

11th Grade Science | Graphical Literacy Assessment Worksheet (PDF+ Answer Key)
Description
Equip your 11th-grade science students with essential skills in data visualization and graphical analysis through this comprehensive Graphical Literacy worksheet assessment. Designed specifically to meet the needs of advanced placement (AP) students, this print-ready PDF resource offers a rigorous challenge that enhances students' ability to interpret, construct, and critique scientific graphs effectively. Teachers often face the challenge of ensuring students grasp complex concepts such as data accuracy, proper graph selection, and honest data representation. This worksheet provides targeted practice that builds confidence and mastery in these vital skills, ensuring students are well-prepared for AP exams and future scientific endeavors.
Why Teachers Love This
✅ Saves valuable prep time—ready-to-use PDFs make implementation straightforward with minimal setup
✅ Classroom-friendly, print-ready format designed for immediate use in in-person settings
✅ Emphasizes core skills like data interpretation, graph construction, and evaluation of visual data
✅ Aligned with AP curriculum standards to support rigorous science instruction
Why Students Succeed With This
✅ Engaging activities that clarify complex concepts of scientific data visualization
✅ Variety of question types foster critical thinking—from multiple choice to essays
✅ Real-world scenarios and authentic data visualizations relate directly to scientific research
✅ Builds confidence in analyzing and creating accurate, honest graphs, a key skill for AP success
What You Get
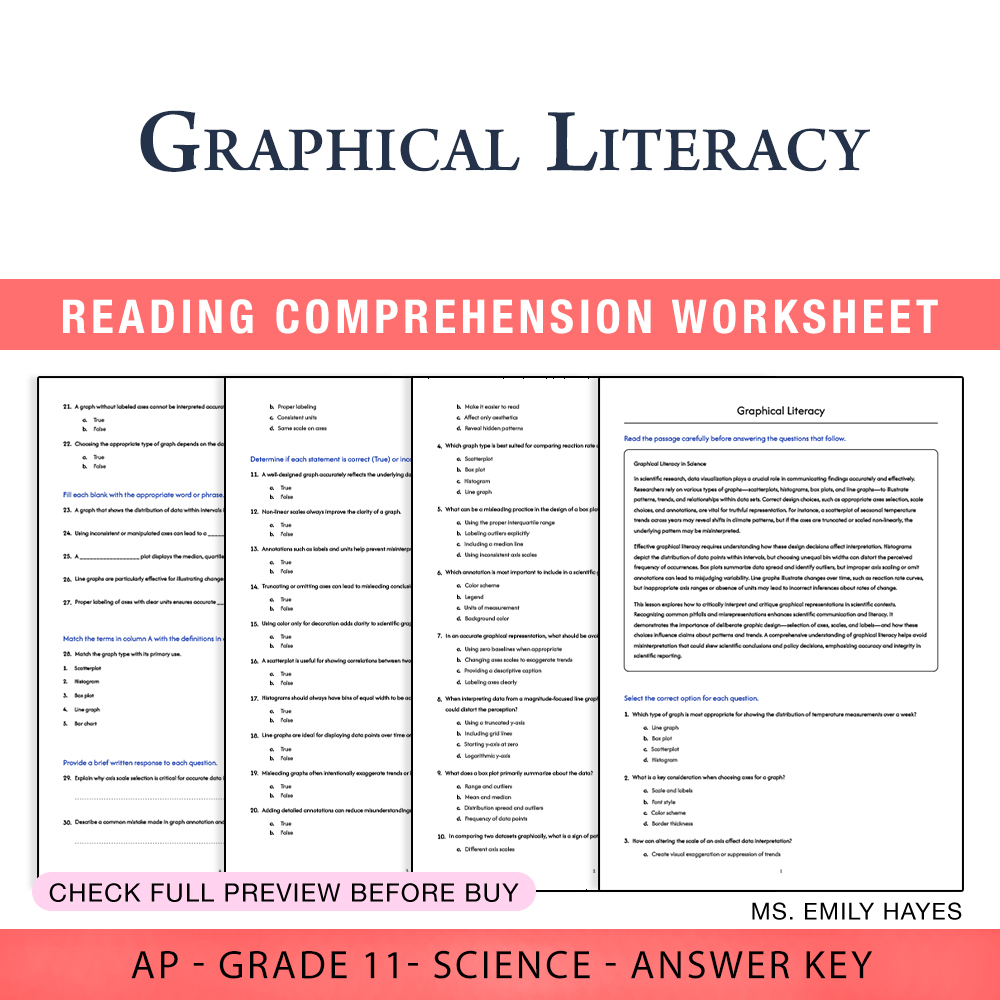
Complete, print-ready PDF worksheet assessment including:
• A detailed passage on data visualization in scientific research
• 10 multiple-choice questions focused on graph types and best practices
• 12 true/false questions assessing understanding of graph accuracy and scale
• 5 fill-in-the-blank questions on types of graphs and interpretation
• 1 matching exercise linking graph types to their uses
• 5 short-answer questions to deepen discussions on scale selection and data interpretation
• 2 comprehensive essay prompts on principles of honest graph design and visual data conventions
— PLUS an answer key with rubric for objective assessment
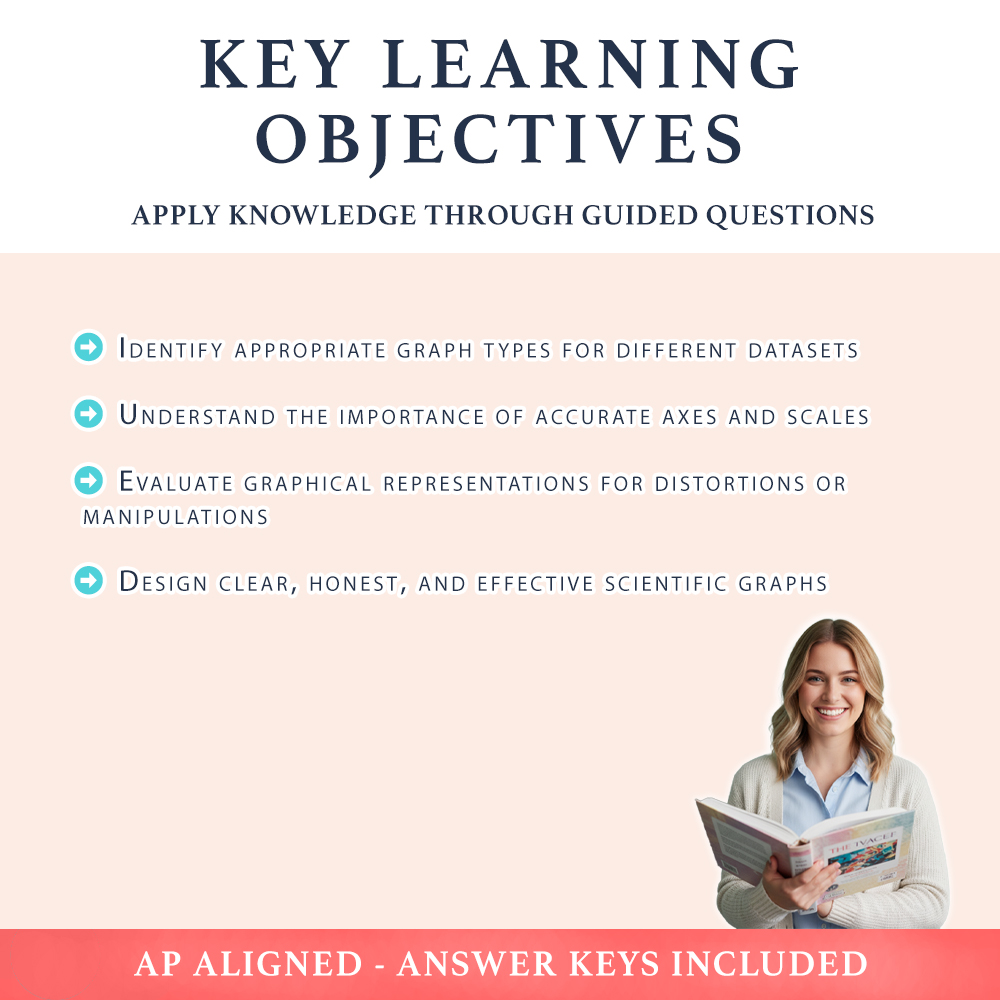
Key Learning Objectives
Students will master these essential skills:
➡️ Identify appropriate graph types for different datasets
➡️ Understand the importance of accurate axes and scales
➡️ Evaluate graphical representations for distortions or manipulations
➡️ Design clear, honest, and effective scientific graphs
Ideal Usage
This worksheet is perfect for classroom practice, homework, or exam preparation. It can be easily integrated into lessons on data interpretation, scientific communication, and visual literacy. The PDF format ensures seamless printability, making it ideal for whole-class or small-group activities, independent practice, or formative assessment aligned with AP standards. Use it to foster critical thinking skills in analyzing data visualizations or as a rigorous assessment tool to measure student proficiency in graphical literacy skills essential for success in science research and reporting.
Get your students engaged and proficient in the crucial art of graphical literacy—an indispensable skill that supports their understanding of complex scientific concepts and prepares them for higher-level research! 🚀