

12th Grade Science | Data Analysis Techniques Worksheet (PDF+ Answer Key)
Description
Empower your students with essential skills in data analysis and interpretation by utilizing this comprehensive 12th grade science worksheet focused on Data Analysis Techniques. This resource addresses the common classroom challenge of helping students grasp complex concepts like graphical visualization, residual analysis, and statistical reasoning, equipping them to confidently analyze real-world scientific data. With a carefully designed structure that promotes active engagement, this worksheet is perfect for strengthening critical thinking, improving data literacy, and fostering an understanding of scientific investigation methods.
Why Teachers Love This
✅ Ready-to-use, print-ready PDF worksheet and answer key with rubric, saving valuable preparation time.
✅ Designed for seamless classroom integration with minimal setup—print and distribute instantly.
✅ Encourages practical skill development in data interpretation, graphical analysis, and statistical evaluation aligned with TEKS standards.
✅ Supports diverse instructional strategies such as guided practice, independent study, or assessment.
Why Students Succeed With This
✅ Clear, concise instructions guide students through complex analysis tasks confidently.
✅ Varied question formats including reading comprehension, multiple choice, true/false, fill-in-the-blank, matching, short answer, and essay promote engagement and deeper understanding.
✅ Realistic data scenarios and graphical interpretation exercises connect learning to authentic scientific research.
✅ Builds essential skills such as critical thinking, data presentation, and effective scientific communication—crucial for future science coursework and careers.
What You Get
Fully prepared PDF worksheet and answer key with rubric, including:
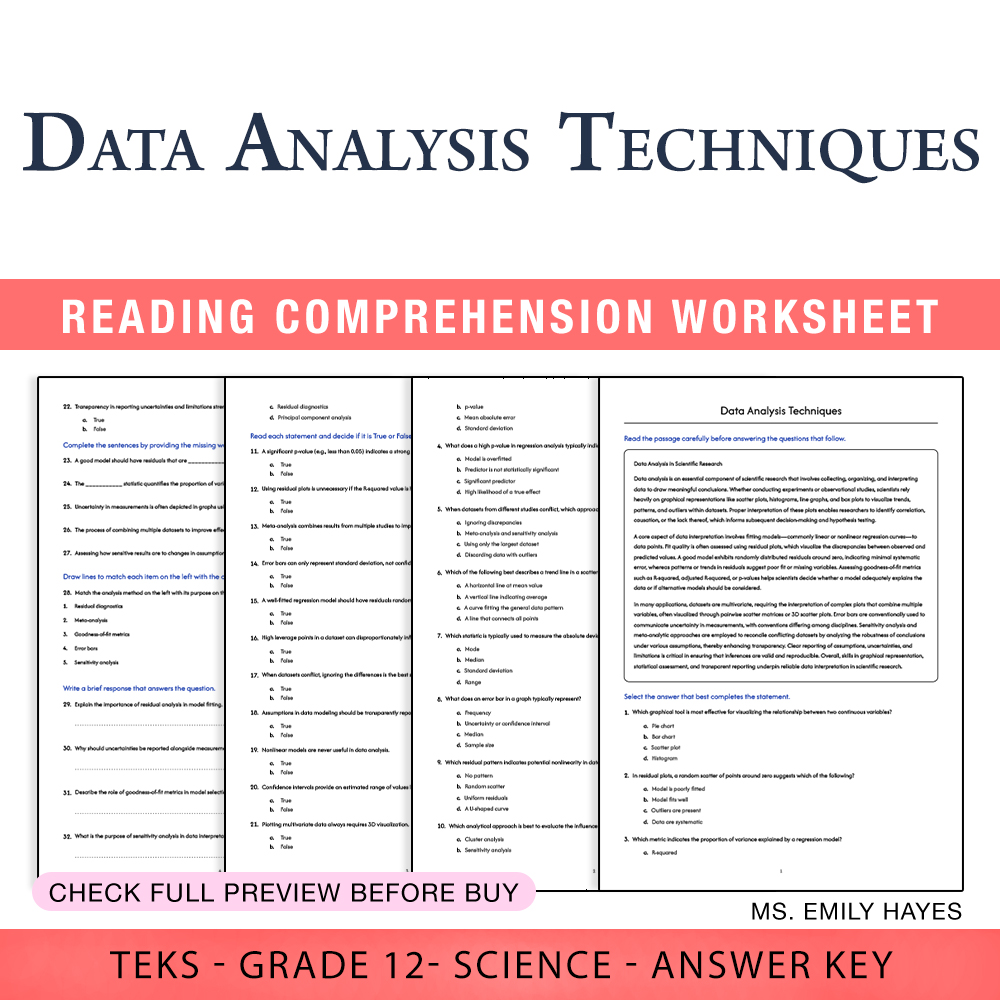
• Text-based reading passage on Data analysis is an essential part of scientific research
• 10 multiple choice questions evaluating recognition of graphical and residual analysis concepts
• 12 true/false questions for quick assessment of statistical understanding
• 5 fill-in-the-blank questions focusing on residuals and variance explanation
• 1 matching item linking analysis methods to their purpose
• 5 short answer questions on residual analysis and reporting uncertainties
• 2 essay prompts encouraging reflection on graphical and statistical approaches in science
Key Learning Objectives
Students will master these core skills:
➡️ Interpretation of various graphical tools such as scatterplots and residual plots
➡️ Understanding of residuals, their patterns, and what they reveal about model fit
➡️ Application of statistical measures like R-squared and p-values to evaluate models
➡️ Communication of uncertainty and limitations in scientific data analysis
Ideal Usage
Perfect for classroom practice, homework, or assessment sessions. This worksheet provides a structured way for students to apply theory to real-world data analysis scenarios. It’s suitable for in-class exercises, lab activities, or independent review, enhancing student proficiency in scientific data interpretation and statistical reasoning. Teachers can easily integrate it into existing curricula to foster analytical thinking and scientific literacy.
Close with an energetic, action-oriented call to boost student mastery in data analysis today! Equip your class with this valuable resource to develop long-term skills in scientific investigation and data literacy 🚀