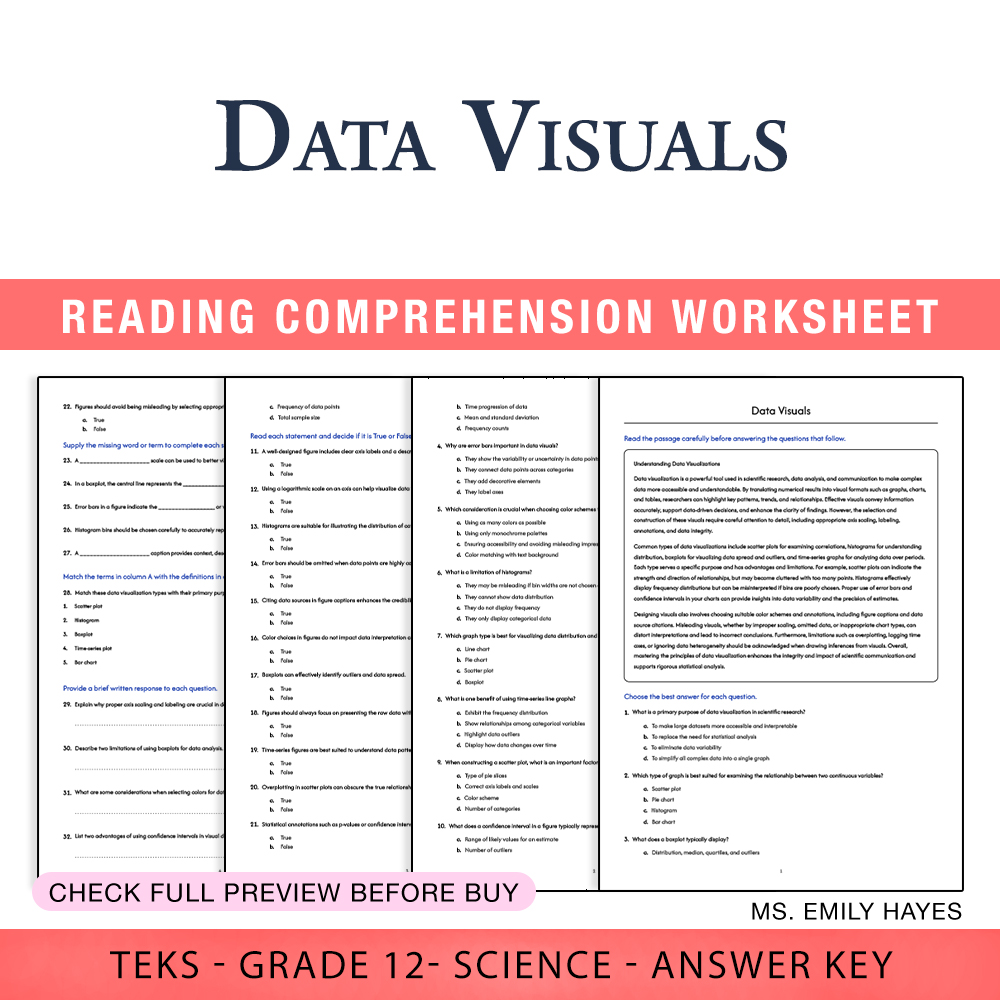


12th Grade Science | Data Visuals Worksheet (PDF+ Answer Key)
Description
Are your students struggling to grasp the significance of effective data visualization in scientific research? This Grade 12 Science Data Visuals Worksheet provides a comprehensive, print-ready resource designed to build students' skills in interpreting, creating, and analyzing various data visualizations essential for success in advanced science coursework. With a focus on real-world application and critical thinking, this worksheet equips students to present their data clearly and analyze visual information confidently.
Why Teachers Love This
✅ Builds essential skills in data analysis and visualization aligned with TEKS standards
✅ Fully printable PDF worksheet and answer key with rubric—ready for immediate classroom use
✅ Promotes critical thinking through diverse question formats including reading passages, multiple-choice, true/false, fill-in-the-blank, matching, and short-answer questions
✅ Encourages student engagement with relevant examples like graph interpretation, scale understanding, and visualization techniques
Why Students Succeed With This
✅ Clear, step-by-step instructions designed to improve comprehension of complex concepts in data visualization
✅ Through scaffolded questions, students develop confidence in selecting appropriate visual tools—like bar graphs, scatter plots, and boxplots
✅ Promotes deeper understanding by analyzing the strengths and limitations of various visualization types
✅ Prepares students for higher-level data interpretation tasks needed in research and STEM careers 🌟
What You Get
This meticulously crafted, print-ready PDF includes:
- A detailed reading passage explaining the importance of data visualization in scientific contexts
- 10 multiple-choice questions focusing on concepts like graph selection and purpose
- 12 true/false questions emphasizing best practices for figure design and appropriate scaling
- 5 fill-in-the-blank exercises reinforcing understanding of terminology and concepts
- 1 matching activity to associate visualization types with their primary function
- 5 short-answer prompts encouraging critical thinking about effective visualization strategies
- 2 essay questions that challenge students to discuss best practices and analyze visualization impacts
- PDF answer key with rubric for effortless assessment
Key Learning Objectives
Students will master these essential skills:
➡️ Identify and explain different data visualization types
➡️ Recognize effective design principles for scientific figures
➡️ Interpret data from various visual formats accurately
➡️ Evaluate visualization effectiveness and limitations
Ideal Usage
Perfect for classroom practice, homework, or assessment prep, this worksheet seamlessly integrates into lessons on data analysis, experimental reporting, or research methods. Its print-ready format is ideal for in-person instruction, whether used in whole-class discussions, small-group workshops, or independent workstations. Offering a variety of question types, it caters to diverse learning preferences and helps reinforce critical thinking skills essential for success in STEM coursework. Use it to promote active learning, enhance understanding of scientific data, and prepare students for real-world scientific communication challenges 🚀