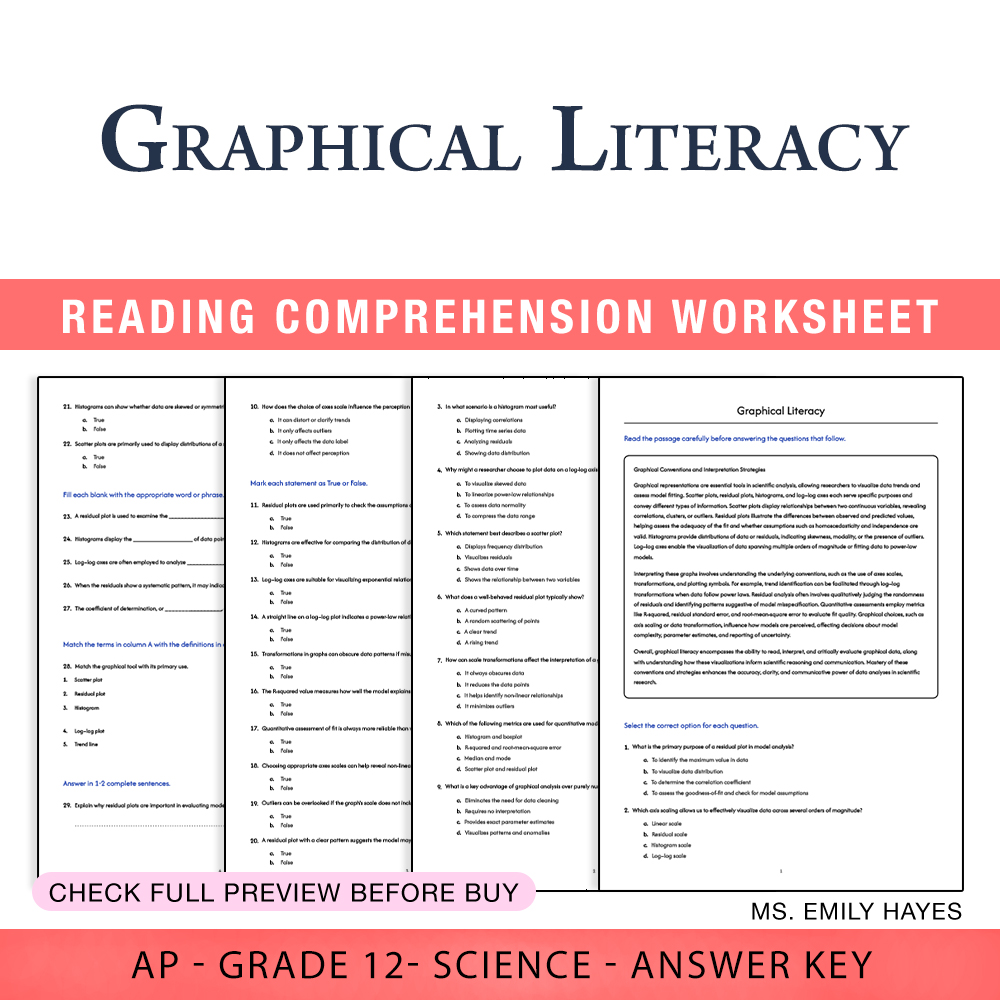


12th Grade Science | Graphical Literacy Worksheet (PDF+ Answer Key)
Description
Maximize your students' data interpretation skills with this comprehensive Graphical Literacy Worksheet Assessment designed specifically for Grade 12 science students. In today’s data-driven scientific landscape, the ability to interpret, analyze, and evaluate graphical representations is essential. This print-ready PDF not only provides a structured approach to mastering graph reading but also helps students develop critical thinking skills necessary for success in advanced scientific analysis, laboratory reporting, and research evaluation 🚀. Teachers will appreciate the ready-to-use materials that facilitate effective classroom instruction without the need for additional resources or preparation.
Why Teachers Love This
✅ Fully prepared, print-ready PDF worksheet and answer key with rubric, ready for immediate classroom application
✅ Engages students through diverse question types, promoting active learning and critical analysis
✅ Covers core graphical literacy concepts essential for AP science standards
✅ Enhances assessment accuracy with clearly defined rubric and structured questions
✅ Supports in-class and homework use, fostering independent and collaborative learning
Why Students Succeed With This
✅ Develops fundamental skills in reading and interpreting complex graphs and data visualizations
✅ Reinforces understanding through varied question formats including multiple choice, true/false, fill-in-the-blank, matching, and short answer
✅ Encourages deeper engagement with scientific graphing tools such as residual plots, histograms, and scatter plots
✅ Stimulates critical thinking about data representation choices like axis scaling and transformation effects
✅ Builds confidence in analyzing real-world data scenarios, crucial for AP exams and scientific research
What You Get
Complete, print-ready PDF worksheet and answer key with rubric, including:
• 35 questions spanning multiple formats and difficulty levels
• Graphic and text-based questions focused on graphical analysis methods
• Clear rubric for objective assessment of student responses
• Designed for quick print and immediate classroom use, suitable for individual, group, or exam review scenarios
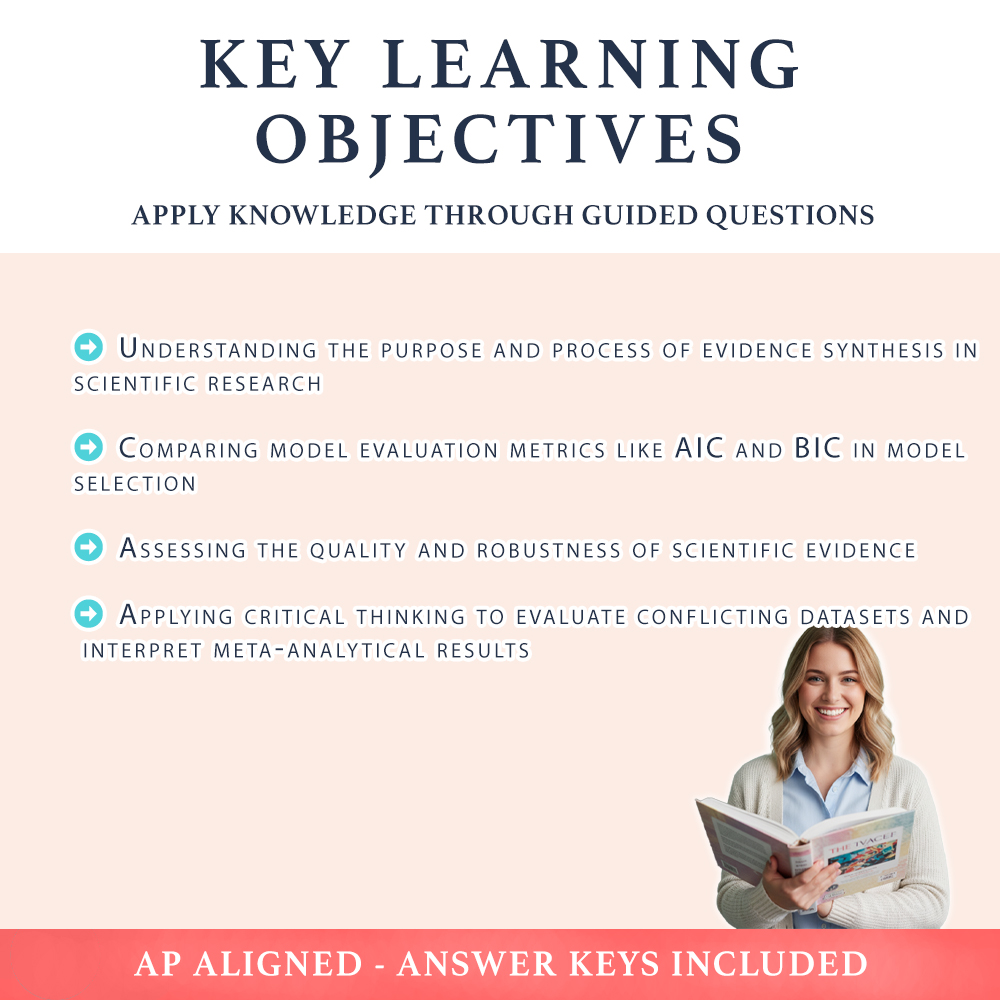
Key Learning Objectives
Students will master these essential skills:
➡️ Understanding the importance of various graph types in scientific analysis
➡️ Interpreting residual plots to evaluate model fit and assumptions
➡️ Analyzing the impact of axis scaling and data transformation on graphical data interpretation
➡️ Matching the correct graphical tool to its intended scientific purpose
Ideal Usage
This worksheet assessment is perfect for classroom exercises, homework, or review sessions aimed at strengthening graphical literacy. Use it as a standalone resource for formative assessment or as part of an AP practice exam to prepare students for real-world data analysis challenges. Its print-ready, teacher-friendly format ensures seamless integration into busy lesson plans, enabling quick setup and immediate feedback for enhanced learning outcomes.
Unlock your students’ potential in scientific data interpretation — equip them with critical graphical analysis skills that will serve them well beyond the classroom! ✅