

6th Grade Science | Data Representation Worksheet (PDF+ Answer Key)
Description
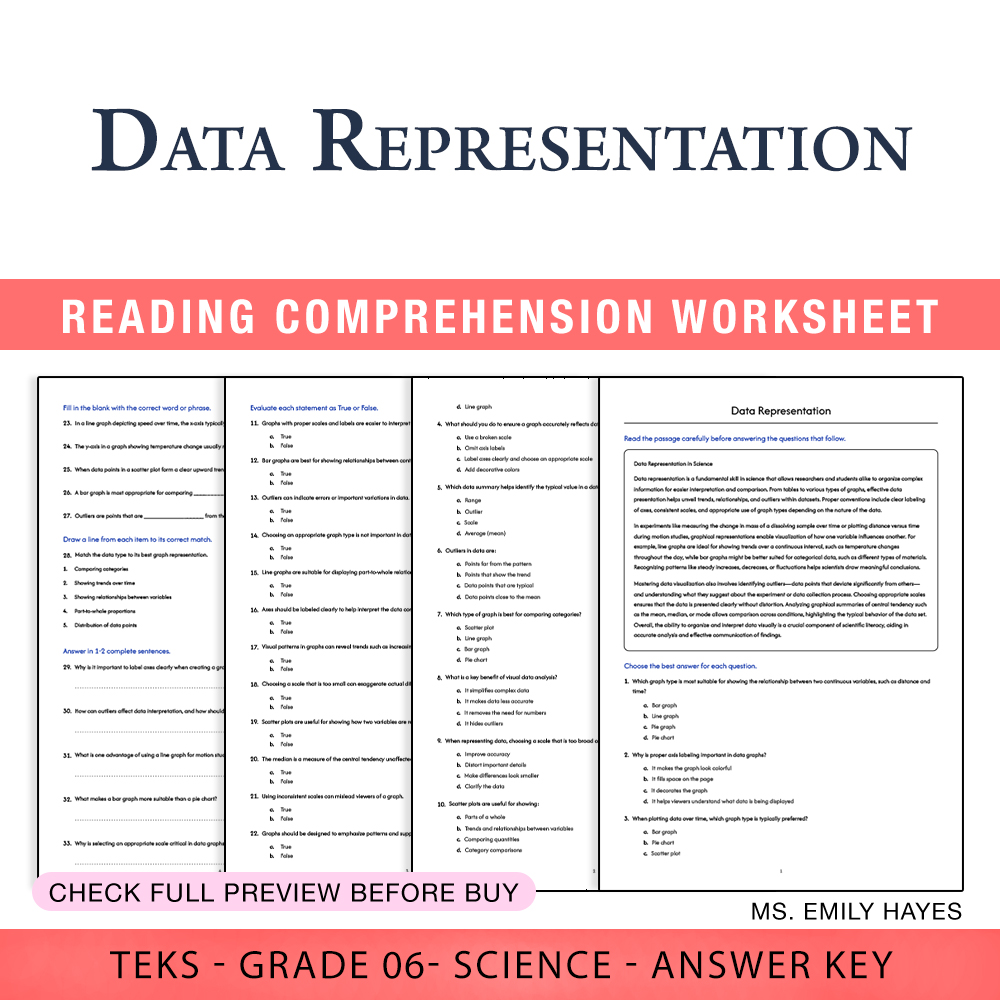
Are you seeking an effective way to help your 6th-grade students master the essential skill of data representation in science? This comprehensive, print-ready PDF worksheet is designed to address one of the most common classroom challenges: teaching students how to accurately interpret and create various data visualizations. With this resource, teachers can facilitate engaging lessons that build students' confidence in understanding graphs, charts, and data analysis — crucial skills aligned with the TEKS standards. From simple bar graphs to complex line graphs, this worksheet guides students through real-world scenarios and expert-relevant examples to deepen their understanding and improve their data literacy.
Designed for in-person classroom use, this worksheet offers a practical, ready-to-print format that makes instruction straightforward and efficient. It includes a variety of question types, such as reading passages, multiple choice, true/false, fill-in-the-blank, matching, and short-answer questions, all crafted to promote critical thinking, comprehension, and technical skills. The accompanying PDF answer key with rubric allows teachers to easily assess student progress and provide targeted feedback, streamlining your grading process and saving valuable prep time.
Why Teachers Love This
✅ Saves preparation time with ready-to-use, high-quality content tailored to TEKS
✅ Simple to implement—print-and-go format with no complex setup needed
✅ Focuses on key skills like data interpretation, graph types, and data analysis
✅ Fully aligned with Grade 6 science standards for seamless integration into your curriculum
Why Students Succeed With This
✅ Engaging visuals and clear instructions that make complex concepts accessible
✅ Scaffolded questions increase confidence as students progress from basic to advanced tasks
✅ Incorporates real-world examples to help students see the relevance of data skills
✅ Enhances ability to interpret scientific data, a critical skill for future STEM success
What You Get
Complete, print-ready PDF worksheet and answer key including:
• 35 thoughtfully crafted questions covering a broad range of data representation topics
• Varied question formats to reinforce understanding — reading, multiple choice, true/false, fill-in-the-blank, matching, and short answers
• Clear rubrics to evaluate student responses effectively
• Designed for immediate classroom use to maximize instructional time
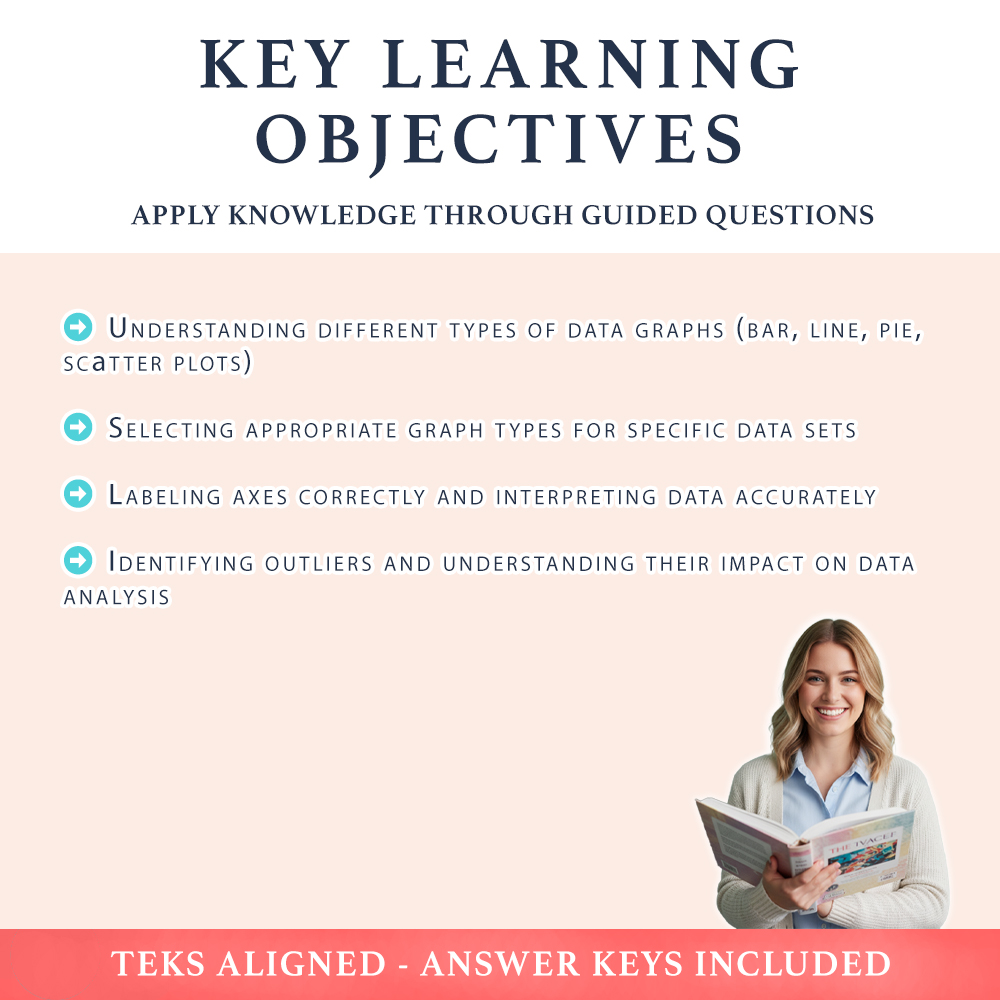
Key Learning Objectives
Students will master these core skills:
➡️ Understanding different types of data graphs (bar, line, pie, scatter plots)
➡️ Selecting appropriate graph types for specific data sets
➡️ Labeling axes correctly and interpreting data accurately
➡️ Identifying outliers and understanding their impact on data analysis
Ideal Usage
Perfect for classroom practice, homework, or review sessions. This worksheet is ideal for whole-class demonstrations, small groups, or independent student work. Its print-ready format ensures quick and easy integration into your lesson plans, making data literacy instruction both straightforward and effective.
Get ready to elevate your science teaching and develop your students’ critical data skills today! This worksheet empowers students to interpret and communicate scientific data confidently and accurately 🚀