

6th Grade Science | Data Representation Worksheet (PDF+ Answer Key)
Description
Addressing one of the enduring challenges in science education, mastering accurate data representation is crucial for middle school students to develop their analytical skills and enhance their understanding of scientific concepts. This comprehensive Grade 6 Science Data Representation worksheet is designed to build students' proficiency in collecting, analyzing, and visually presenting data. It provides teachers with a robust, print-ready resource that simplifies classroom instruction and fosters student independence.
Why Teachers Love This
✅ Ready-to-use, high-quality PDF worksheet and answer key save valuable preparation time
✅ Easy to implement—print and go for seamless classroom integration
✅ Promotes critical thinking through varied question formats that reinforce data interpretation skills
✅ Fully aligned with Ontario curriculum standards for Grade 6 science, ensuring curriculum relevance and comprehensiveness
Why Students Succeed With This
✅ Clear, concise instructions guide students step-by-step through data analysis tasks
✅ Engaging activities that challenge students to apply key concepts like data types, graph selection, and interpretation
✅ Real-world scenarios make learning relevant and relatable, increasing engagement
✅ Builds confidence in creating, reading, and analyzing different types of graphs and charts, essential skills for future scientific and data literacy needs
What You Get
Complete, print-ready PDF materials including:
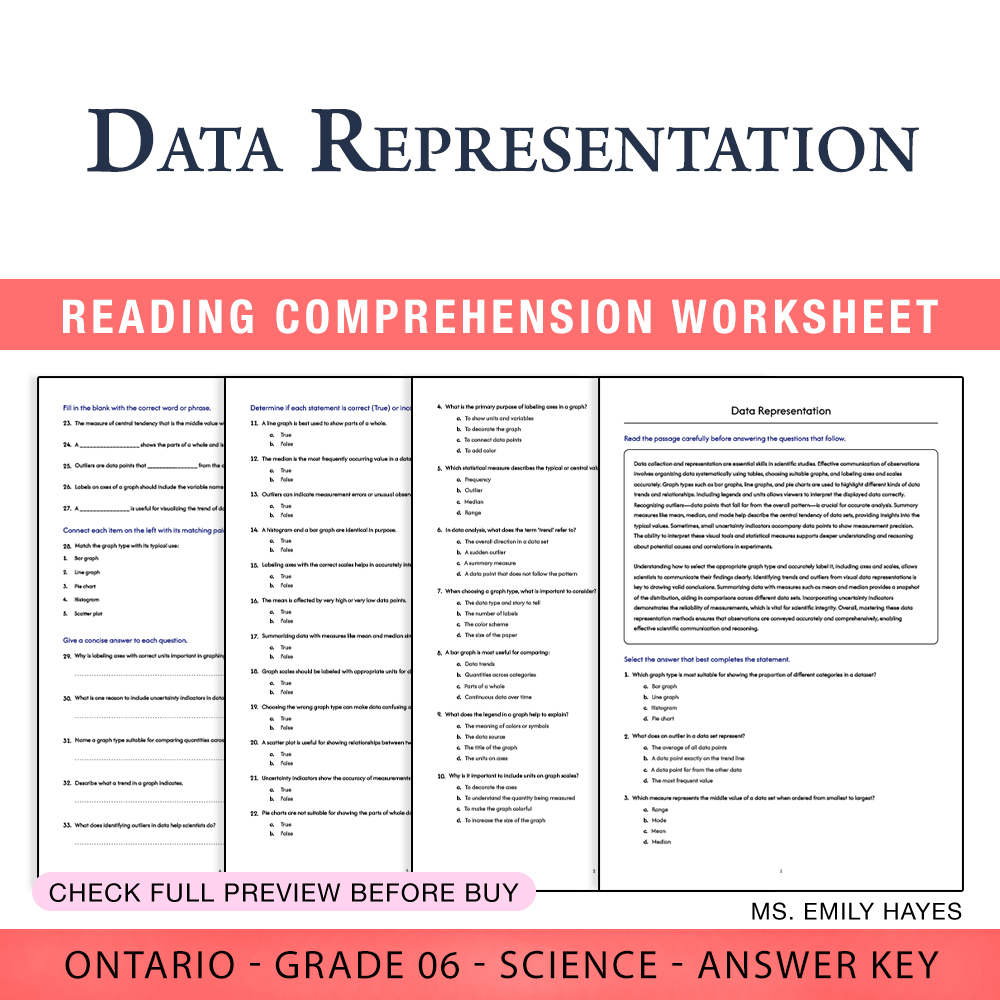
• An engaging reading passage emphasizing the importance of data collection and visualization
• 10 multiple-choice questions to evaluate understanding of graph types and outliers
• 12 true/false questions to assess comprehension of data analysis concepts
• 5 fill-in-the-blank exercises to reinforce vocabulary related to data measures and representations
• 1 matching activity connecting graph types with their typical uses
• 5 short-answer questions prompting students to explain pivotal data concepts
• 2 comprehensive essay prompts fostering critical thinking about data presentation and uncertainty indicators
• PDF answer key with rubric for objective assessment, providing quick and accurate grading—perfect for classroom use
Key Learning Objectives
Students will master these core skills:
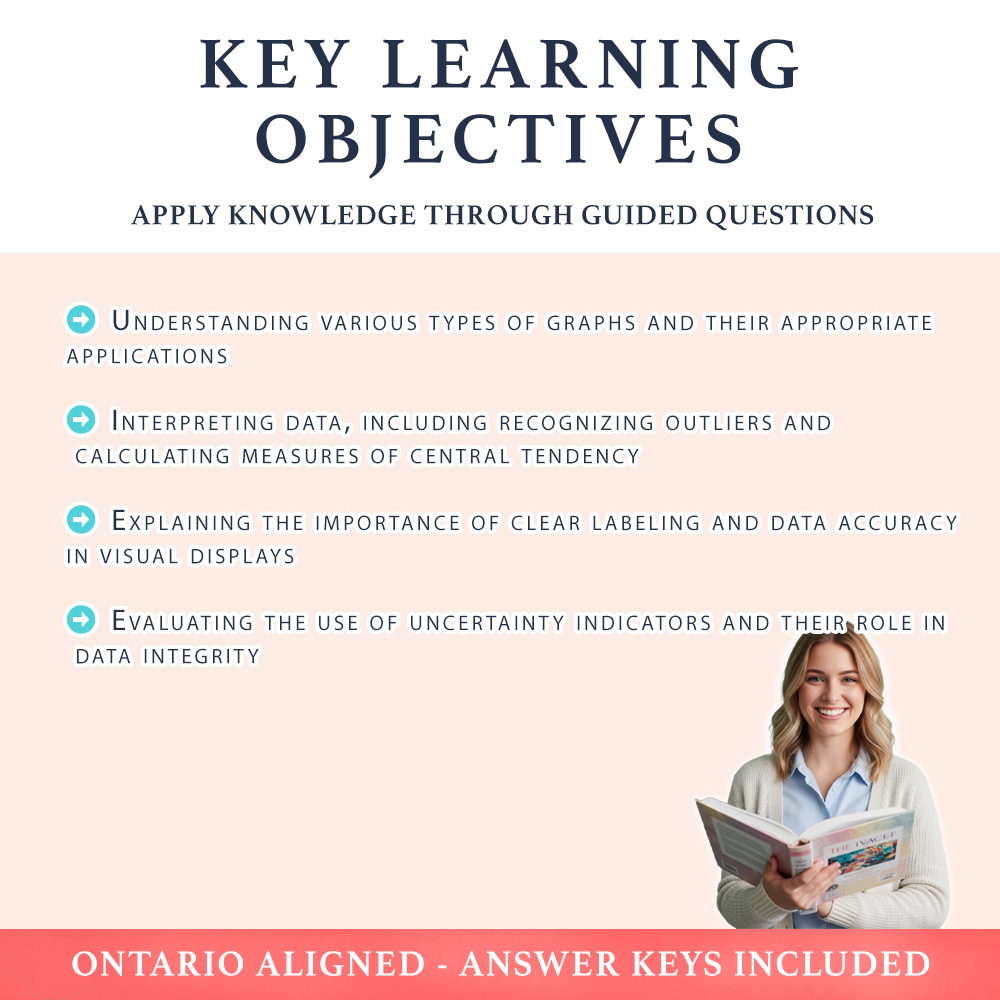
➡️ Understanding various types of graphs and their appropriate applications
➡️ Interpreting data, including recognizing outliers and calculating measures of central tendency
➡️ Explaining the importance of clear labeling and data accuracy in visual displays
➡️ Evaluating the use of uncertainty indicators and their role in data integrity
Ideal Usage
This worksheet is ideal for classroom practice, homework assignments, or review sessions. Its print-ready PDF format is perfect for in-person instruction—use it for whole-class lessons, small-group work, or individual student practice. It helps teachers reinforce key data concepts, foster critical thinking, and prepare students for exams or future science projects. Engaging and thoughtfully designed, it ensures students develop confidence and competence in creating and interpreting data visualizations, skills vital for success in science and everyday decision-making. 🚀
Empower your students to understand data like real scientists! Download this comprehensive worksheet today and see immediate improvements in their data literacy and analytical skills—helping them build a solid foundation for future STEM learning and critical thinking skills.