

7th Grade Science | Statistical Reasoning Worksheet (PDF+ Answer Key)
Description
Are you looking for a dynamic way to strengthen your 7th-grade students' understanding of statistical reasoning in science? This expertly designed print-ready worksheet offers a comprehensive approach to mastering core concepts such as data variability, measures of center, and the interpretation of graphical data. Perfect for in-class activities, homework assignments, or formative assessment, this resource helps teachers confidently build students' data literacy skills essential for scientific inquiry and critical thinking.
Why Teachers Love This
✅ Ready-to-print, high-quality PDF worksheet and answer key with rubric, saving you valuable prep time
✅ Clear, engaging layout designed for easy implementation in any classroom setting
✅ Covers fundamental statistical concepts aligned with TEKS standards - ideal for Grade 7 science instruction
✅ Encourages students to analyze, interpret, and communicate data effectively
Why Students Succeed With This
✅ Promotes critical thinking with varied question types like multiple choice, true/false, fill-in-the-blank, matching, short answer, and essay questions
✅ Builds confidence through scaffolded tasks that gradually increase in complexity
✅ Incorporates real-world scenarios and data sets to connect science learning with everyday life
✅ Strengthens communication skills by explaining the importance of statistical tools and techniques
What You Get
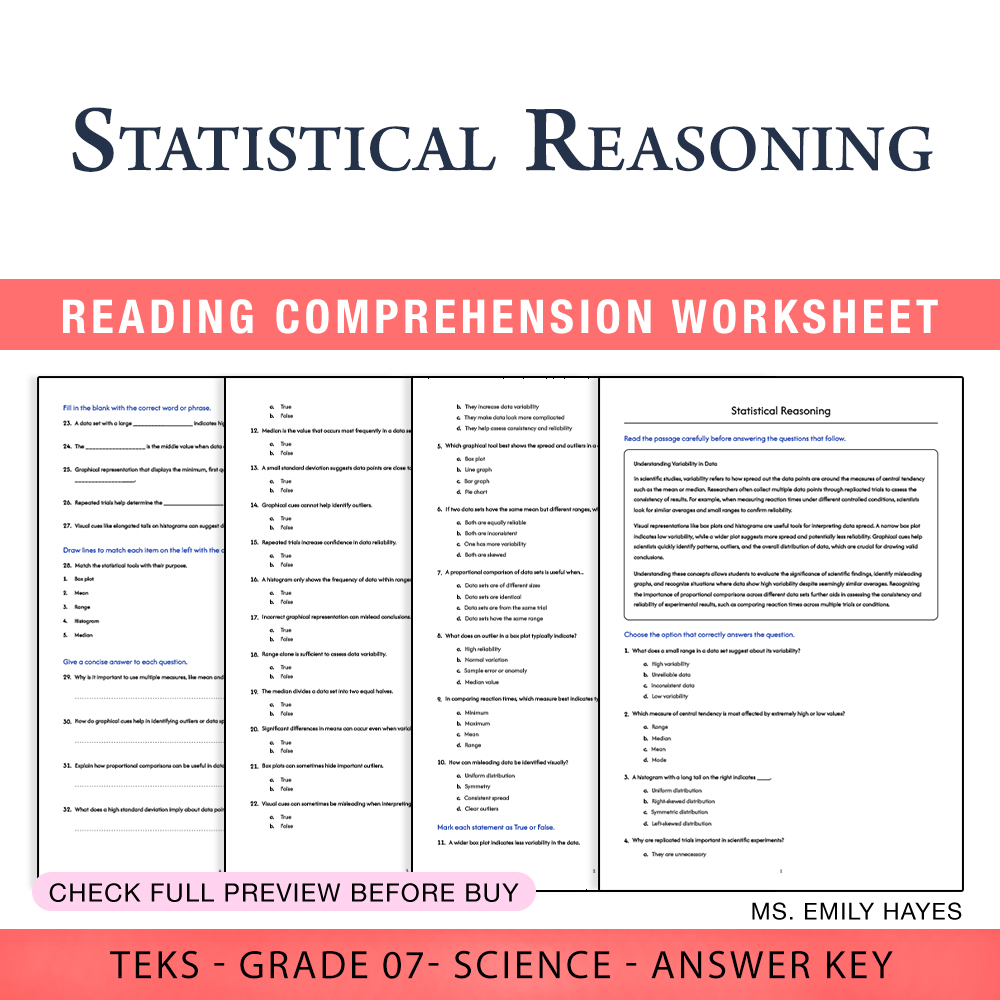
Complete, print-ready PDF worksheet and answer key with rubric, including:
• 35 diverse questions to reinforce statistical reasoning and data interpretation
• Engaging activities covering data variability, measures of central tendency, graphical analysis, and data communication
• Clear instructions and space for student responses, ready for immediate classroom use
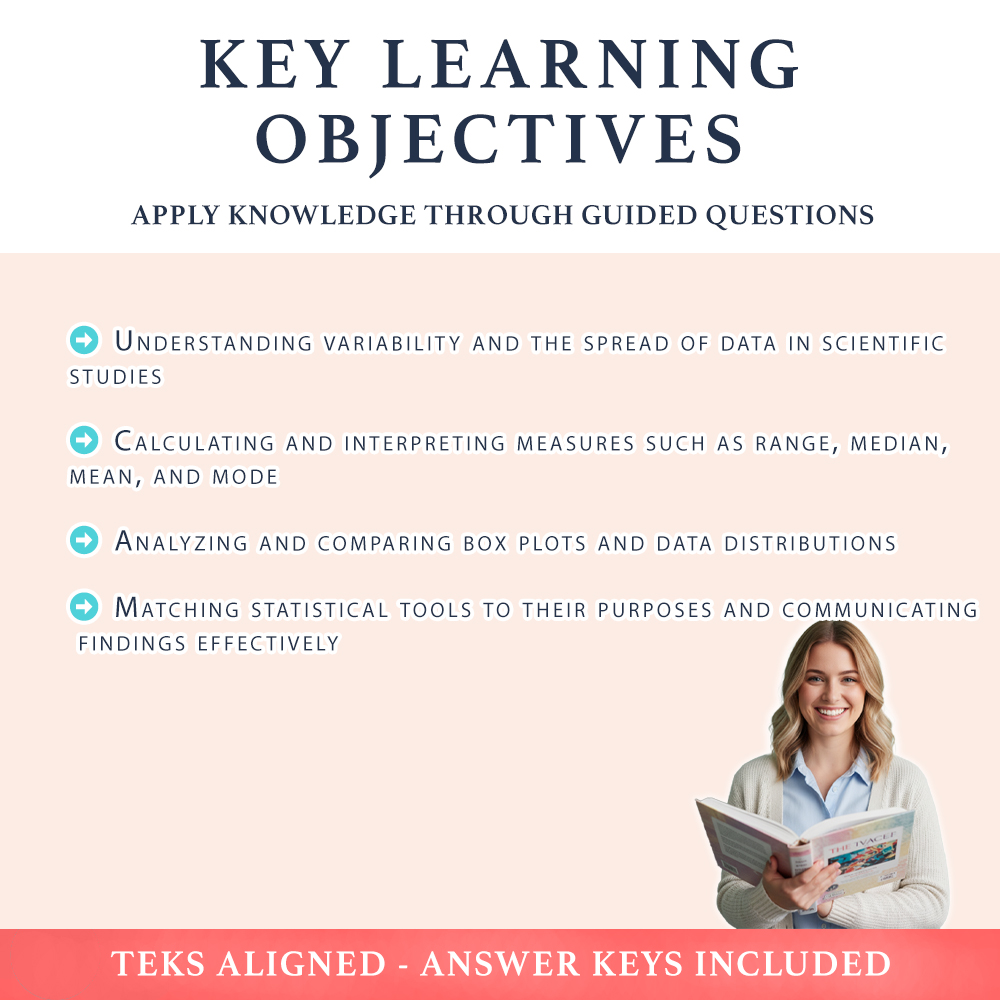
Key Learning Objectives
Students will master these core skills:
➡️ Understanding variability and the spread of data in scientific studies
➡️ Calculating and interpreting measures such as range, median, mean, and mode
➡️ Analyzing and comparing box plots and data distributions
➡️ Matching statistical tools to their purposes and communicating findings effectively
Ideal Usage
Perfect for classroom practice, homework, or assessments, this worksheet supports diverse teaching strategies. Use it as a whole-class activity, small-group exercise, or individual task to reinforce understanding of statistical concepts in science. The print-ready PDF makes it easy to incorporate into your lesson plans without additional hassle. Designed for in-person instruction, it prompts meaningful student engagement and fosters independent analytical skills, all while aligning with TEKS standards for Grade 7 science.
Ready to empower your students with essential data analysis skills? This worksheet provides the tools you need to effectively teach statistical reasoning and help students excel in scientific data interpretation. Bring clarity and confidence to your lessons today! 🚀