


8th Grade Science | Graphical Reasoning Worksheet (PDF+ Answer Key)
Description
Discover a powerful tool to enhance your students' understanding of data interpretation in science with this comprehensive Grade 8 Graphical Reasoning worksheet. Designed specifically for classroom use, this PDF worksheet and answer key provide an engaging, print-ready resource that helps students master the critical skill of analyzing and interpreting scientific graphs. Whether you're preparing for an upcoming assessment or reinforcing key concepts, this resource addresses common student challenges in understanding how to read and analyze various types of graphs such as velocity-time and position-time graphs. By integrating these activities into your lessons, you'll foster deeper comprehension of how graphs visually depict physical phenomena, and you'll equip students with skills essential for success in science and STEM fields.
Why Teachers Love This
✅ Saves preparation time with instant, ready-to-use PDF format designed for quick classroom implementation
✅ Engages students with diverse question types, including reading comprehension, multiple choice, true/false, matching, and short answer questions
✅ Reinforces key graphical reasoning concepts aligned with TEKS standards
✅ Clear, print-ready materials suitable for whole-class, small-group, or independent practice, allowing flexible lesson planning
Why Students Succeed With This
✅ Promotes critical thinking through real-world applications of graph interpretation
✅ Builds confidence in analyzing various graph types with scaffolded question difficulty
✅ Strengthens understanding of concepts such as slope, area, and data trends
✅ Encourages deep learning about graphical reasoning and its role in interpreting physical systems, preparing students for advanced science coursework
What You Get
Printable PDF worksheet bundle including:
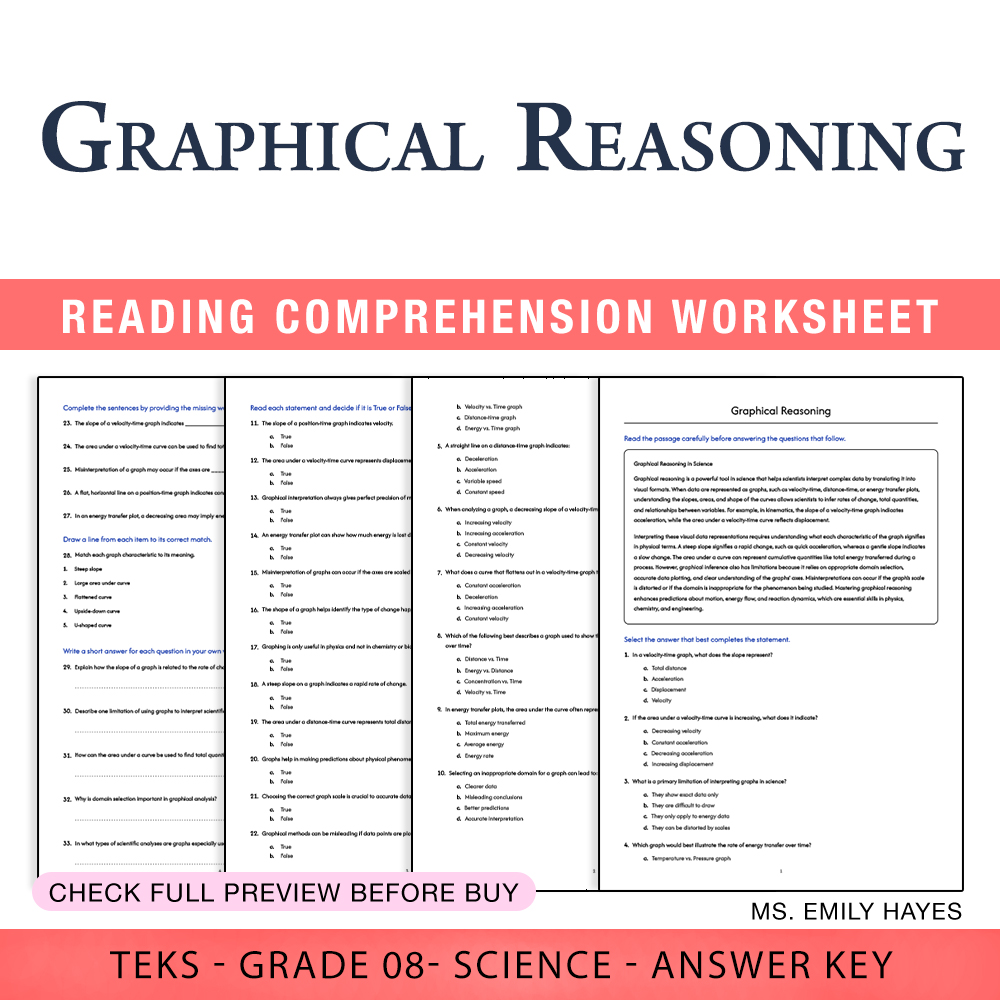
• An engaging reading passage introducing the importance of graphical reasoning in science
• 10 multiple-choice questions testing comprehension of graph concepts such as slope and area
• 12 true/false statements to assess foundational understanding
• 5 fill-in-the-blank exercises focused on key terminology
• 1 matching activity connecting graph characteristics to their meanings
• 5 short answer prompts encouraging critical thinking and explanation skills
• 2 thought-provoking essay questions to deepen understanding of the role of graphs in scientific discovery
Key Learning Objectives
Students will master these core skills:
➡️ Interpreting the slope of velocity-time and position-time graphs
➡️ Calculating displacement and understanding the significance of the area under the curve
➡️ Analyzing graph data to draw meaningful conclusions about physical phenomena
➡️ Developing critical thinking through explanation and discussion of graphical data interpretation
Ideal Usage
This worksheet is perfect for in-class practice, homework assignments, or review sessions. Its printable PDF format is ready for immediate classroom use, making it ideal for whole-group lessons, small-group activities, or independent student work. Use it to reinforce concepts taught during lessons on graphs and data analysis or as an assessment tool to gauge student understanding of graphical reasoning. The activities promote active student engagement and provide a valuable check of comprehension, all without the need for digital tools or resources.
Close this activity by inspiring your students to become confident in interpreting the visual language of science. Equip them with the skills to analyze graphs like experts, fostering a love for data and discovery in STEM fields! 🚀