


9th Grade Science | Graphical Literacy Worksheet (PDF+ Answer Key)
Description
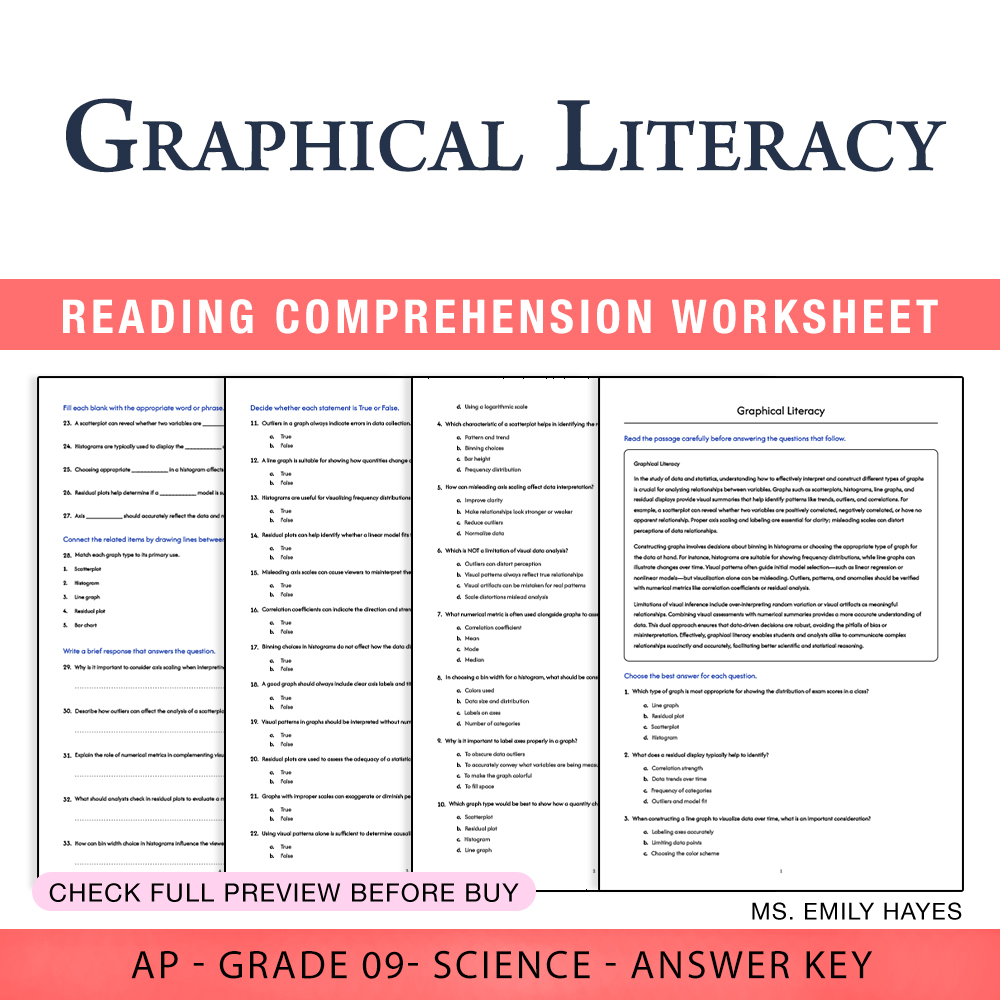
Are you seeking a powerful resource that helps your 9th-grade students master the essential skill of graphical literacy? This print-ready PDF worksheet is designed to address a common classroom challenge: developing students’ ability to interpret, construct, and analyze various types of graphs and data visualizations. In the modern data-driven world, understanding how to read and create meaningful graphics is fundamental for students aiming to excel in science and other STEM disciplines. This comprehensive worksheet not only builds critical data interpretation skills but also enhances students' ability to analyze real-world information, supporting their success on standardized assessments and fostering lifelong analytical skills. The accompanying PDF answer key with rubric ensures you can easily evaluate students’ understanding and provide clear feedback, making your teaching more effective and efficient.
Why Teachers Love This
✅ Built-in activities that align with AP standards for data analysis and graph interpretation
✅ Ready-to-print PDF format that requires no additional setup—just print and use
✅ Engaging, varied question formats including reading comprehension, multiple choice, true/false, fill-in-the-blank, matching, and short answer to keep students actively involved
✅ Supports different classroom activities—practice, assessment, or homework—offering flexible use for your teaching needs
Why Students Succeed With This
✅ Clear and concise instructions help students understand the purpose of each activity
✅ Progressive difficulty boosts confidence as students develop their skills step-by-step
✅ Real-world scenarios and relatable data visuals improve engagement and contextual understanding
✅ Focuses on critical thinking skills essential for analyzing data trends and patterns, preparing students for high-stakes testing and science coursework
What You Get
Complete, print-ready PDF worksheet featuring:
• 30+ questions spanning various types to build comprehensive graphical literacy
• An answer key with rubric for objective and thorough assessment
• Clear layout designed for seamless classroom integration and student engagement
Key Learning Objectives
Students will master these core skills:
➡️ Identify appropriate graph types for data analysis
➡️ Interpret residuals and outliers in data sets
➡️ Compare and match graph types to their primary uses
➡️ Describe the impact of axis scaling and outliers on data interpretation
Ideal Usage
This versatile worksheet is perfect for in-class practice, homework assignments, or formative assessments. Use it as a standalone resource or as part of a data analysis unit—especially valuable when teaching data visualization or statistics. Its print-ready format makes it ideal for whole-class activities, small group work, or individual student practice, with flexibility to fit any classroom routine.
Energize your students’ understanding of graphical data today with this comprehensive, standards-aligned worksheet collection—helping them build confidence in interpreting data visuals and strengthening their analytical skills for future success! 🚀