

9th Grade Science | Variability Metrics Worksheet (PDF+ Answer Key)
Description
Are you struggling to help your Grade 9 students grasp the essential concepts of data variability and statistical dispersion? This comprehensive Variability Metrics worksheet is designed to address a common classroom challenge: making the abstract concepts of variability tangible and engaging for students mastering statistics within their science curriculum. Perfect for in-class practice, homework assignments, or assessment preparation, this print-ready PDF provides a structured approach to understanding variability – a foundational skill for scientific data analysis and interpretation.
Why Teachers Love This
✅ Saves valuable instruction time with immediate access to high-quality, ready-to-use materials
✅ Easy to implement in any classroom setting—print, distribute, and teach
✅ Interactive questions that foster critical thinking and deepen understanding of data spread and distribution
✅ Fully aligned with Advanced Placement (AP) standards, ensuring curriculum relevance
Why Students Succeed With This
✅ Clear, straightforward instructions make complex concepts accessible
✅ Tasks are scaffolded to ensure gradual mastery of measures like variance, IQR, and coefficient of variation
✅ Real-world examples reinforce the importance of variability in scientific research and data analysis
✅ Designed to build confidence and analytical skills necessary for success in AP science exams, data projects, and beyond
What You Get
Complete, teacher-friendly PDF materials including:
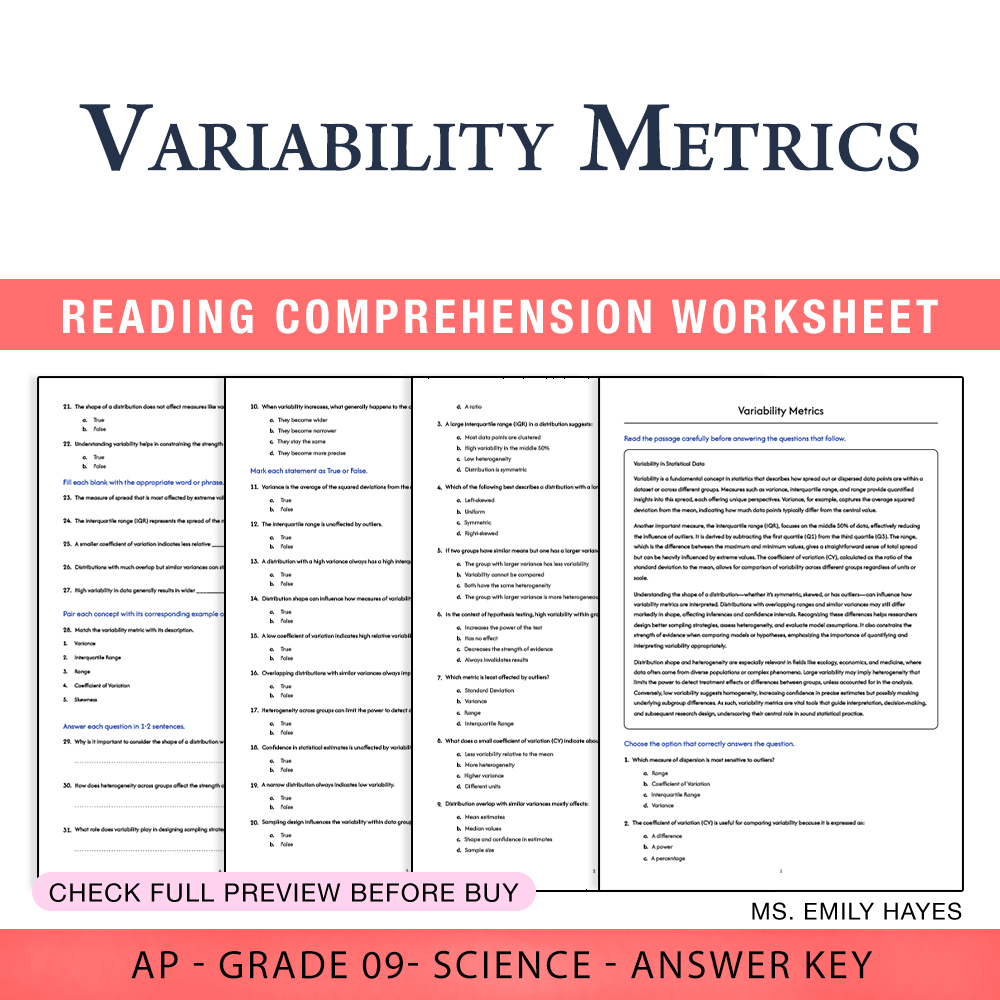
• 35 thoughtfully crafted questions covering reading, multiple choice, true/false, fill-in-the-blank, matching, and short answer formats
• PDF answer key with rubric for objective and comprehensive assessment
• Pristine, print-and-go layout ideal for immediate classroom use
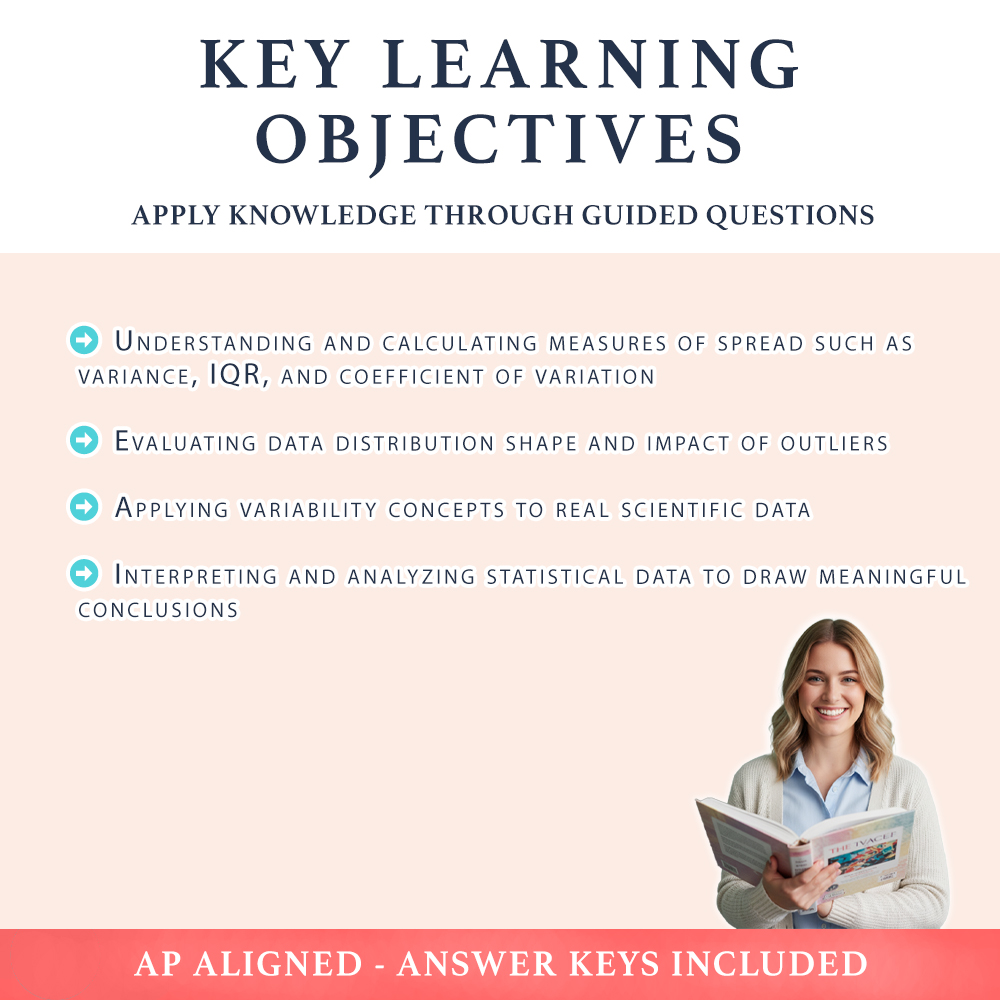
Key Learning Objectives
Students will develop proficiency in:
➡️ Understanding and calculating measures of spread such as variance, IQR, and coefficient of variation
➡️ Evaluating data distribution shape and impact of outliers
➡️ Applying variability concepts to real scientific data
➡️ Interpreting and analyzing statistical data to draw meaningful conclusions
Ideal Usage
This worksheet is perfect for classroom practice, homework, or review sessions. The print-ready PDF format makes it seamless to incorporate into lessons, whether in a whole-group setting or small-group activities. It supports students working independently or in collaborative environments, fostering essential skills needed for success in AP science assessments and advancing data analysis capabilities.
Equip your students with the vital skills of understanding variability and distribution—critical competencies in scientific data analysis. Download this worksheet today to boost student engagement and mastery of core statistical concepts! 🚀