
Data Visualization Assessment for Grade 10 Science Standards | AP
Description
📘 Classroom Snapshot
Enhance your Grade 10 Science instruction with this comprehensive Data Visualization assessment designed to evaluate students’ understanding of visual data analysis. This classroom-ready material aligns with advanced placement standards and offers teachers a structured way to assess students' skills in interpreting and communicating scientific data visually. These printable materials support the development of critical data skills essential for high-level science coursework and AP exam preparation.
📝 Resource Details & Scope
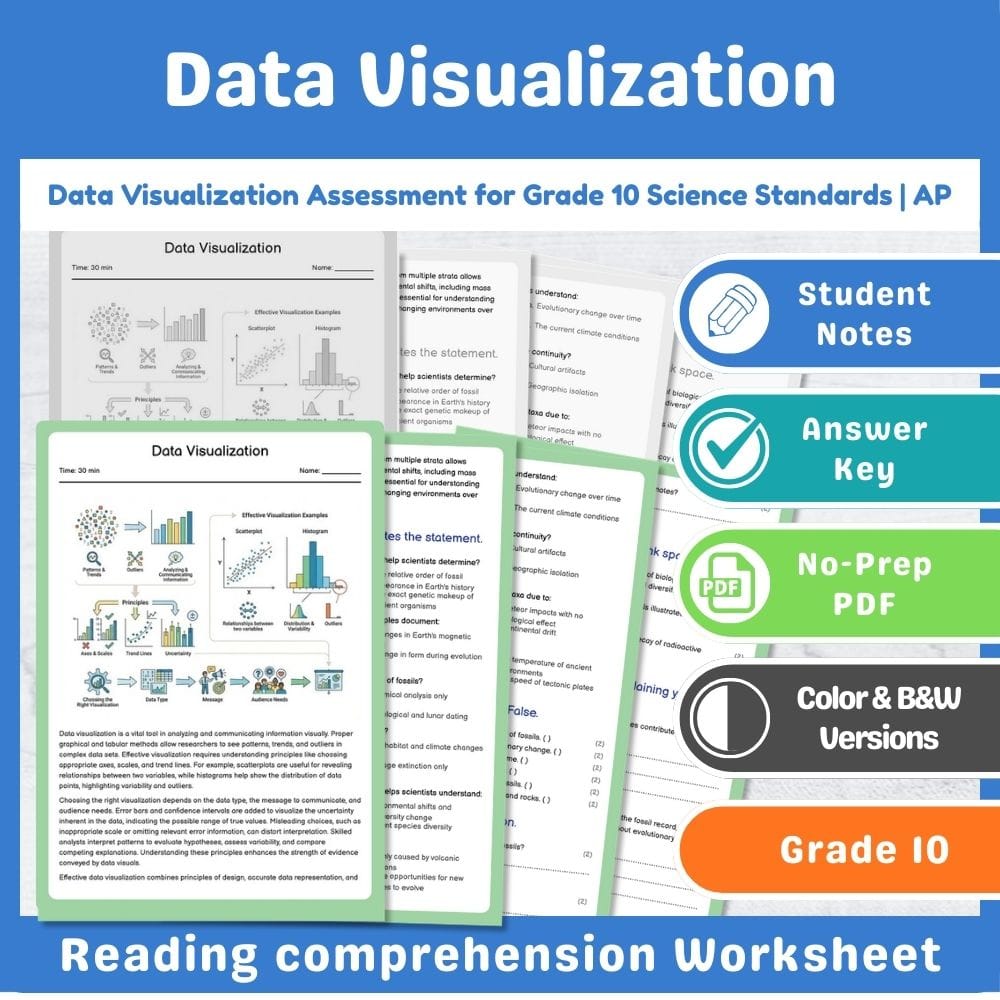
• Two worksheet formats: black-and-white version and full-color version (both included)
• Student Cornell Notes pages aligned to the lesson using a structured note-taking layout
• An infographic-style chart embedded within the worksheet to support visual understanding of the lesson
• Answer Key Included
• More question types for varied assessment
All files are provided as PDF only.
No digital or interactive materials are included, ensuring you have printable, high-quality resources for immediate classroom use.
📊 Standards & Skills
• Aligned with AP standards for high school science and data visualization skills
• Students will be able to interpret different types of data visualizations, such as histograms and boxplots
• Analyze and evaluate the appropriateness of various visualization methods for scientific data
• Communicate findings effectively using visual data representations
• Demonstrate understanding of uncertainty representation through error bars and residual plots
⏱️ How This Saves You Time
This worksheet provides a fully formatted, print-ready assessment with built-in visuals and structured student notes, making lesson planning effortless. Its clear layout, embedded graphics, and variety of question types reduce prep time and ensure smooth implementation. Designed for immediate classroom use, it offers a reliable, standards-aligned assessment that supports high student engagement and accurate evaluation of data visualization skills in science.