Grade 10 Science | Data Visualization Reading Worksheet (PDF + Rubric)
Description
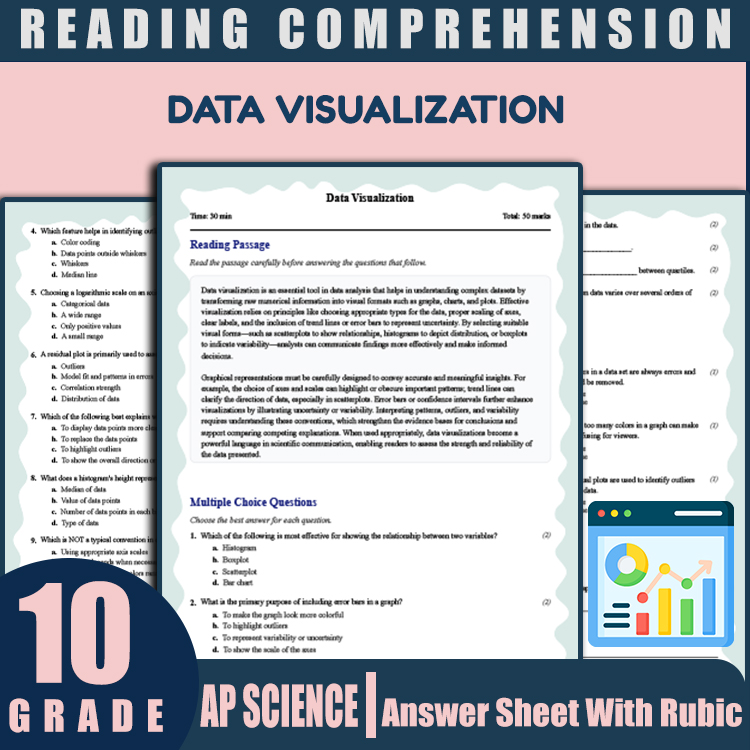
This comprehensive Reading worksheet delivers exactly what your Grade 10 Science students need to master the crucial concept of Data Visualization.
🎯 The Problem It Solves
Teachers often face the challenge of providing engaging, standards-aligned practice materials that help students understand complex scientific data concepts. Finding resources that are ready to use and promote meaningful learning can be time-consuming. This Data Visualization Reading Worksheet offers a professionally-designed, print-ready PDF resource that eliminates that headache. It’s perfect for classroom instruction, homework, or review sessions, providing a valuable tool to enhance student comprehension of data analysis and visualization techniques.
💡 Why This Worksheet Wins
- Standards-aligned to Advanced Placement (AP) Data Analysis standards, ensuring content matches high academic expectations
- Print-ready PDF format—easy to distribute, photocopy, and incorporate directly into lesson plans
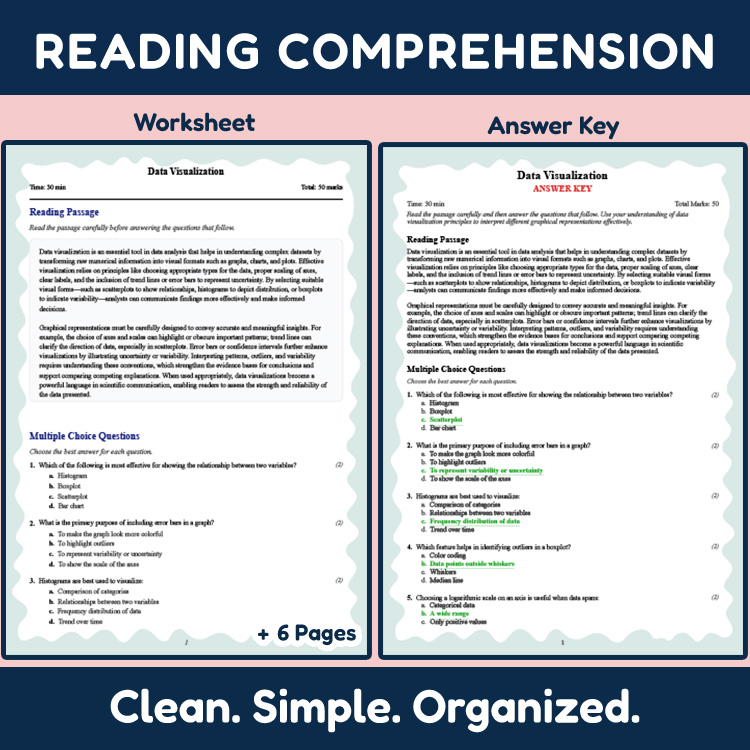
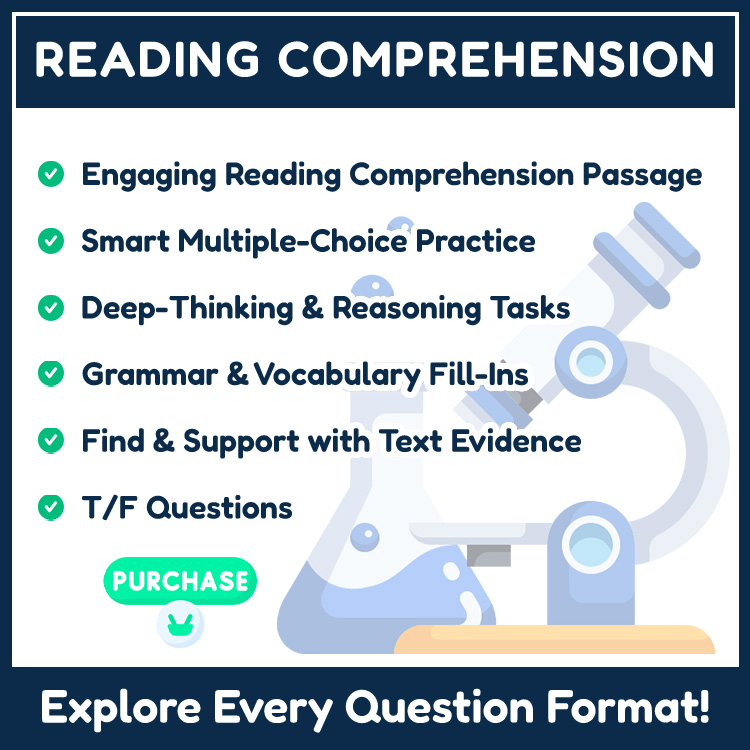
- Multiple question formats: 1 reading passage, 10 multiple choice questions, 5 fill-in-the-blank, 6 true/false statements, 5 short answers, and 1 essay question—covering a broad range of skills
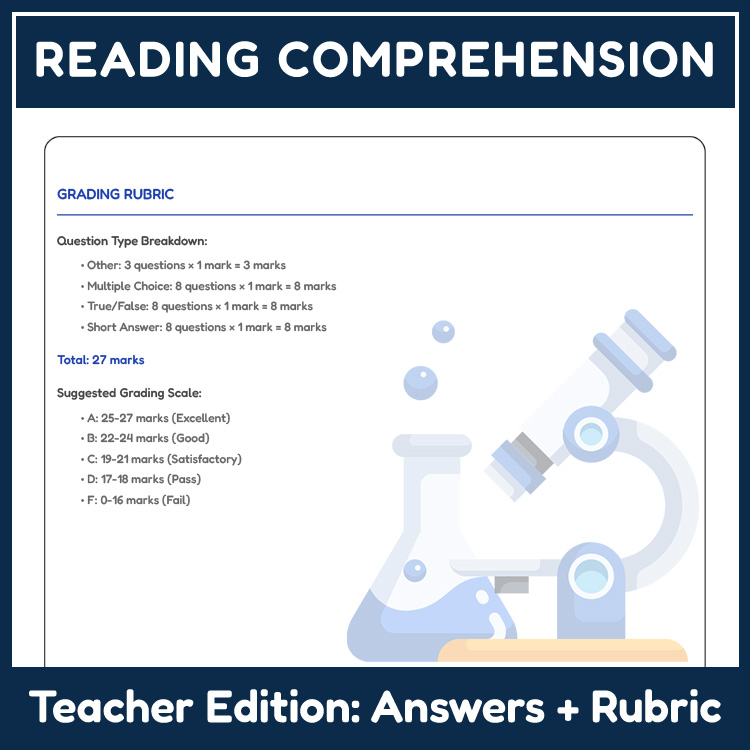
- PDF answer key with rubric
- Engages students with scaffolded questions that build understanding step-by-step from comprehension to critical thinking
📚 What Makes Students Shine
This worksheet is specifically designed so students:
- Understand and interpret visual data representations clearly
- Develop skills in selecting appropriate visualization methods and explaining their effectiveness
- Learn to evaluate and critique different types of charts and graphs
- Build confidence through scaffolded questions that increase in complexity
- Apply their understanding to real-world scientific contexts
✨ Complete Package Includes
- Carefully crafted reading passage explaining data visualization concepts
- Variety of question types designed to reinforce understanding and critical thinking
- PDF answer key with rubric
- Print-and-go format suitable for classwork, homework, or review sessions
🚀 The Result?
Teachers consistently report saving valuable class time, with students showing measurable improvement in data analysis skills. Students gain confidence in interpreting various data visualizations, which is essential for success in AP and college science courses. This resource fosters a deeper understanding of data representations, making science learning engaging and outcome-driven.
Get your Grade 10 Science class focused on what matters. Start using this Data Visualization Reading Worksheet today and see the difference intentional, standards-aligned practice makes in student success.