

Grade 10 Science | Data Visualization Worksheet (PDF+ Answer Key)
Description
Harness the power of effective data visualization with this comprehensive, print-ready worksheet designed specifically for Grade 10 science students mastering advanced data analysis skills. In today's data-driven world, students must learn how to interpret and communicate complex information visually. This worksheet challenges students to develop critical thinking, interpret various types of data visualizations, and understand best practices for presenting scientific data accurately and clearly. Teachers often find that incorporating visual data analysis into their curriculum is essential for developing students' proficiency in scientific reasoning and empirical communication, making this resource a valuable addition to any classroom focused on science and data literacy.
Why Teachers Love This
✅ Saves preparation time with expertly crafted, ready-to-print materials aligned with AP standards
✅ Encourages active student engagement through diverse question types, promoting critical thinking and application
✅ Supports classroom differentiation with a variety of question formats—from multiple choice to short answer
✅ Focuses on core concepts like data interpretation, visualization types, and statistical assessments, ensuring a well-rounded understanding
✅ Provides an answer key with rubric to facilitate quick assessment and feedback, saving valuable instructional time
Why Students Succeed With This
✅ Clear, comprehensible instructions that guide students step-by-step through complex visualization concepts
✅ Interactive question formats that foster higher-order thinking and application of knowledge
✅ Real-world scenarios and examples that make abstract data concepts concrete and relevant
✅ Opportunities to analyze and evaluate different data visualizations, boosting critical data literacy skills
✅ Builds confidence in interpreting and creating scientific graphs, which are vital for science careers and exams
What You Get
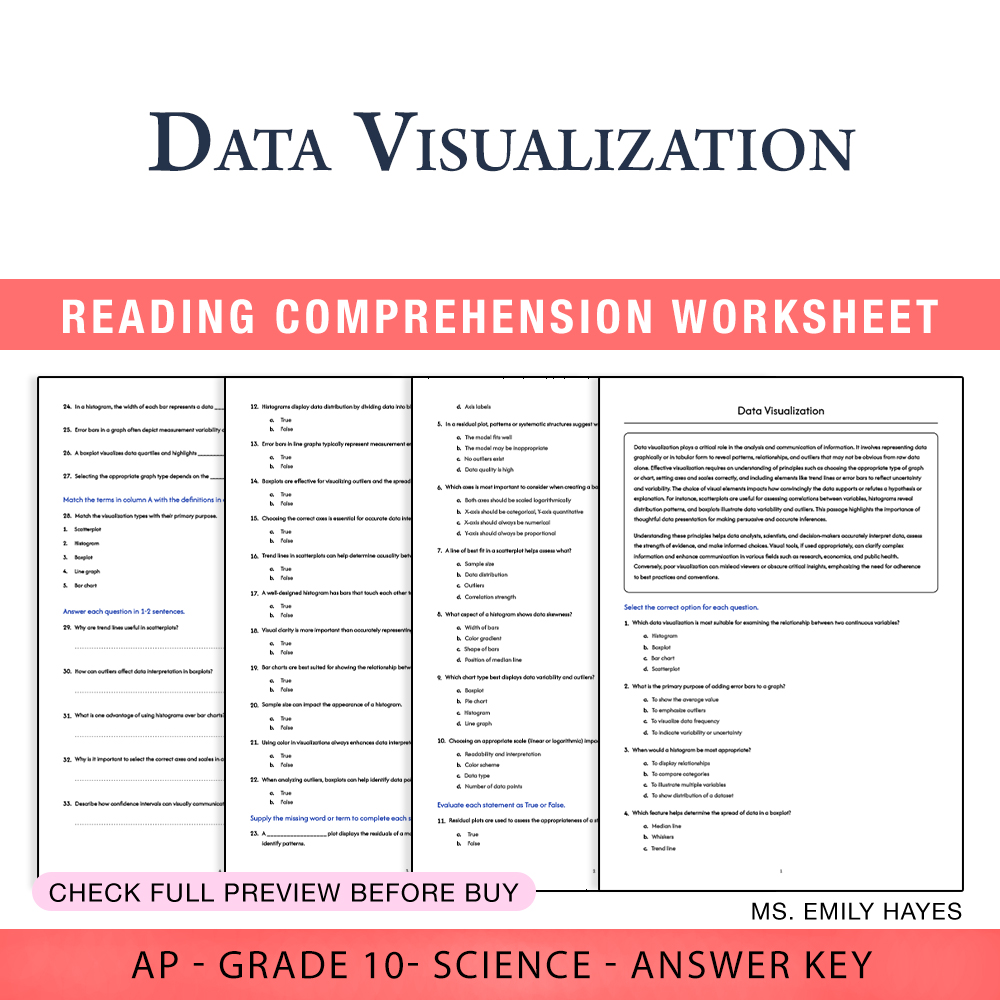
Complete, print-ready PDF worksheet and answer key, including:
• A reading passage explaining the importance of data visualization in science
• 10 multiple-choice questions focused on visualization suitability and interpretation
• 12 true/false questions assessing understanding of residuals, histograms, and model assessments
• 5 fill-in-the-blank exercises reinforcing key terminology like residual plots and data bins
• 1 matching activity pairing visualization types with their main purposes
• 5 short answer questions encouraging analysis of trend lines and outliers
• 2 essay prompts fostering higher-level thinking on visualization choices and presentation principles
Key Learning Objectives
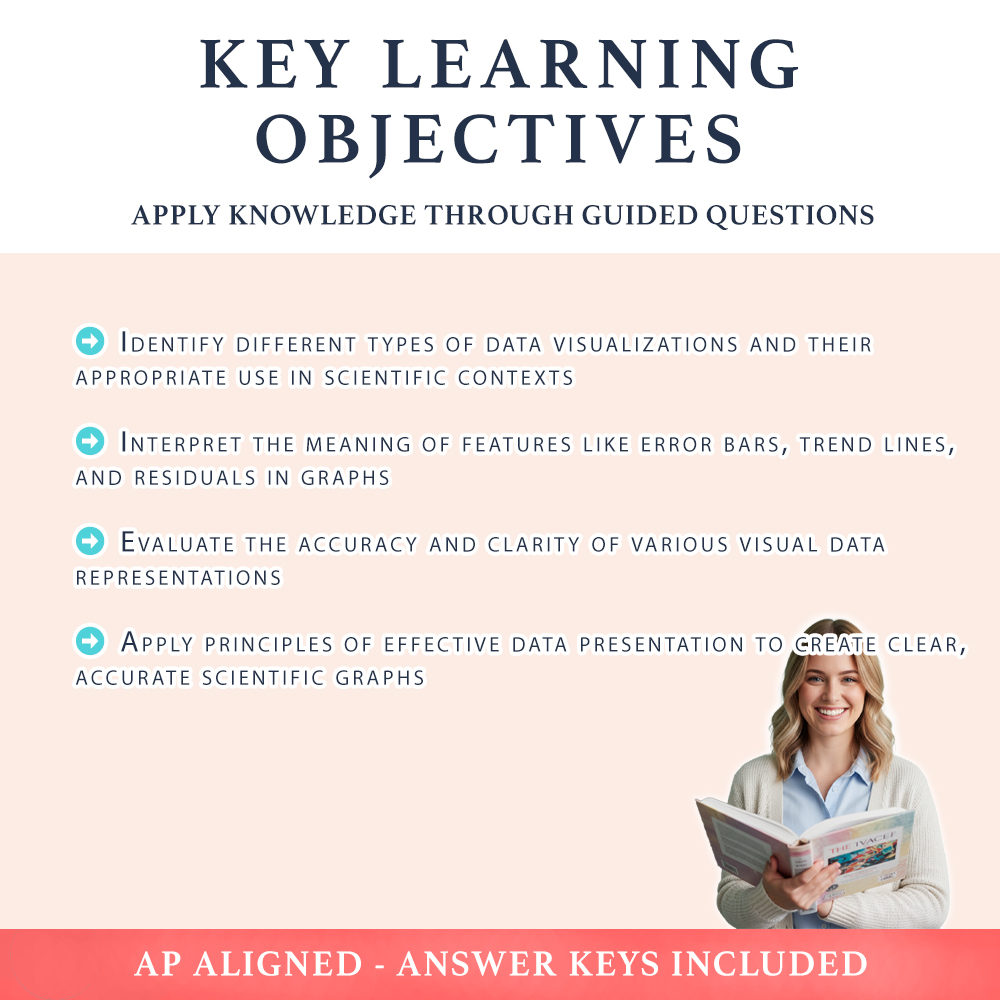
Students will master these core skills:
➡️ Identify different types of data visualizations and their appropriate use in scientific contexts
➡️ Interpret the meaning of features like error bars, trend lines, and residuals in graphs
➡️ Evaluate the accuracy and clarity of various visual data representations
➡️ Apply principles of effective data presentation to create clear, accurate scientific graphs
Ideal Usage
This worksheet is perfect for classroom practice, homework, or exam preparation. Its PDF format makes it easy to print and distribute for in-person teaching, small-group activities, or independent study. Use it for formative assessments, to reinforce data literacy skills, or as a supplement during lessons on scientific data analysis and presentation. The variety of question types ensures engagement and effective review of key concepts, making it an essential tool for busy teachers seeking a comprehensive resource that encourages students to analyze data critically and communicate findings confidently.
Ready to strengthen your students' data visualization skills and empower them to interpret scientific data effectively? Download this worksheet now and support your students in mastering the critical skills needed for success in science and data literacy! 🚀