Grade 10 Science | Representing Data Worksheet Elena | Ontario Standards
Description
Are your Grade 10 students exploring data representation and visualization techniques?
🌿 This worksheet Elena is thoughtfully designed to build understanding of data presentation aligned with Ontario science standards. It offers a comprehensive exploration of how to effectively interpret and create visual data displays, ensuring students develop essential scientific communication skills. These activities support your curriculum by reinforcing key concepts of data analysis and visual literacy, critical for successful science learning at the Grade 10 level.
What's Included
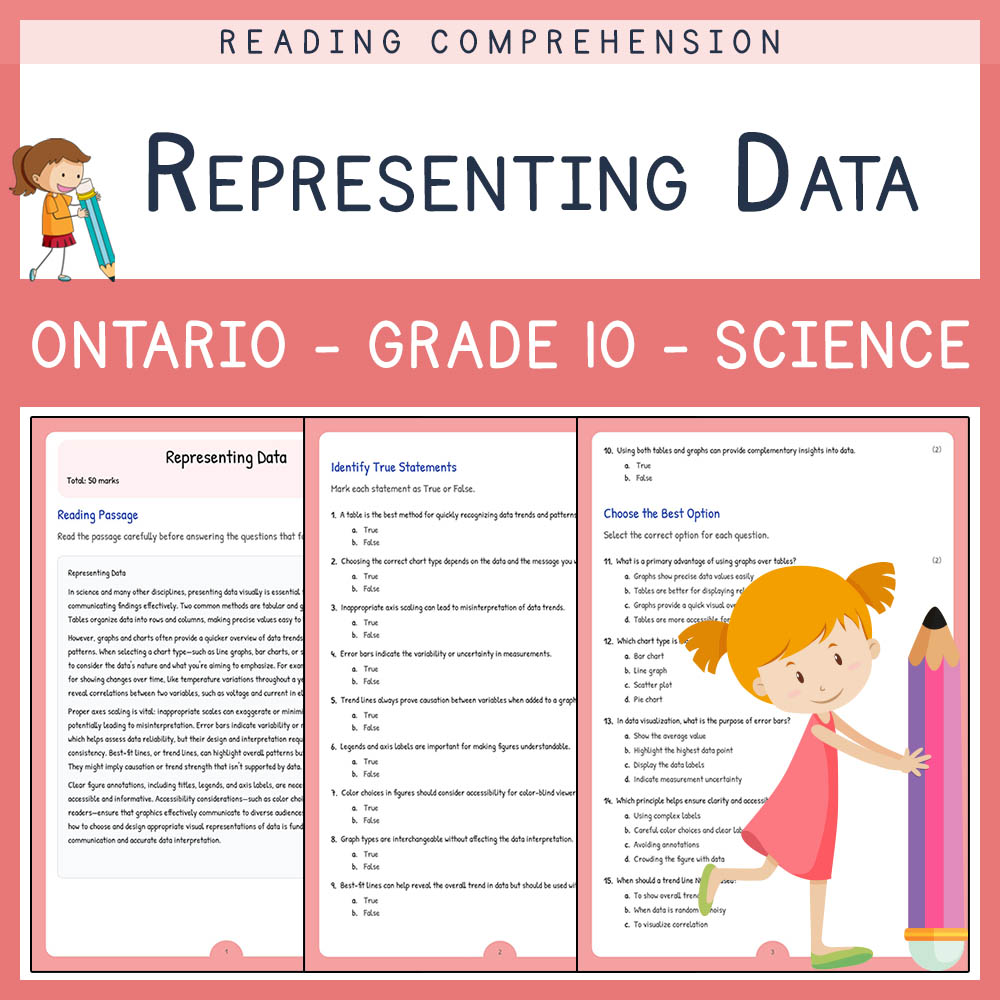
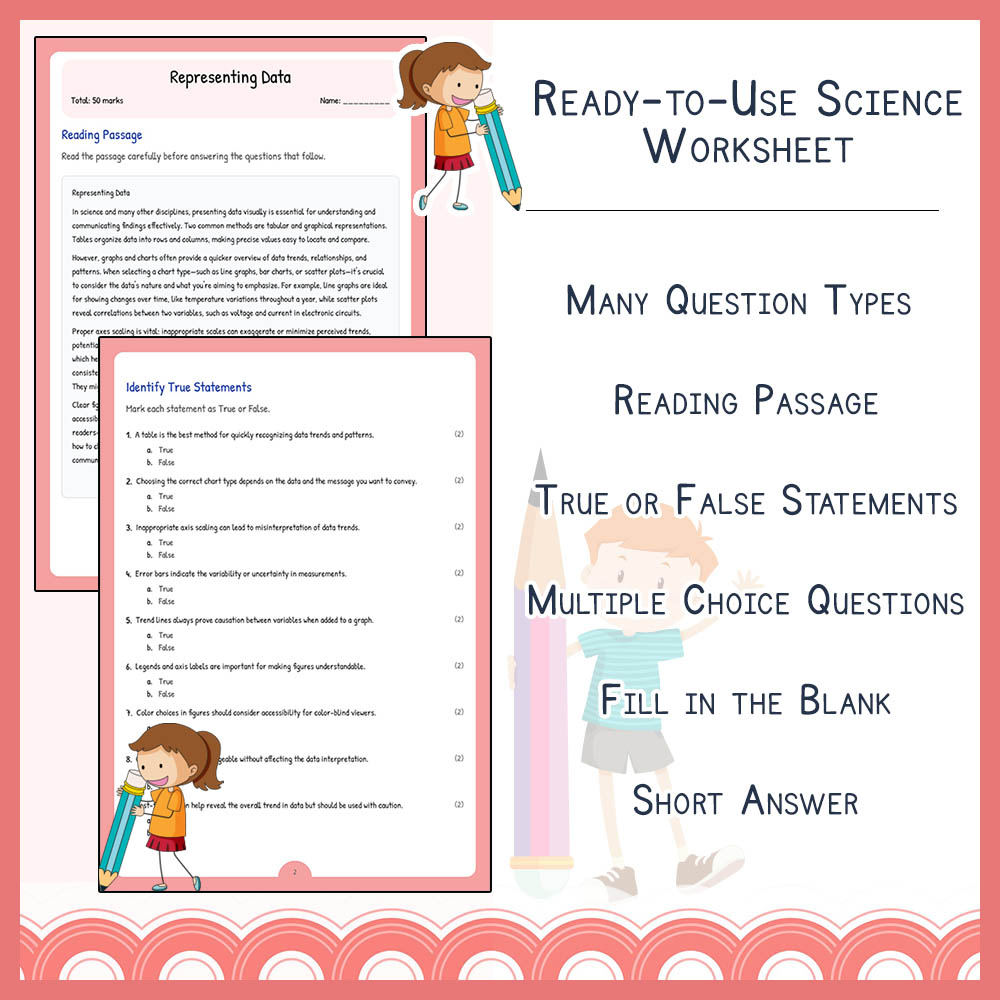
✅ Reading passage with comprehension questions — 1 passage for understanding data presentation importance
✅ Identify true statements — 10 true/false questions to test conceptual knowledge
✅ Choose the best option — 5 multiple choice questions to assess decision-making skills
✅ Complete the sentences — 5 fill-in-the-blank questions promoting critical thinking
✅ Short answer questions — 5 questions encouraging detailed explanations
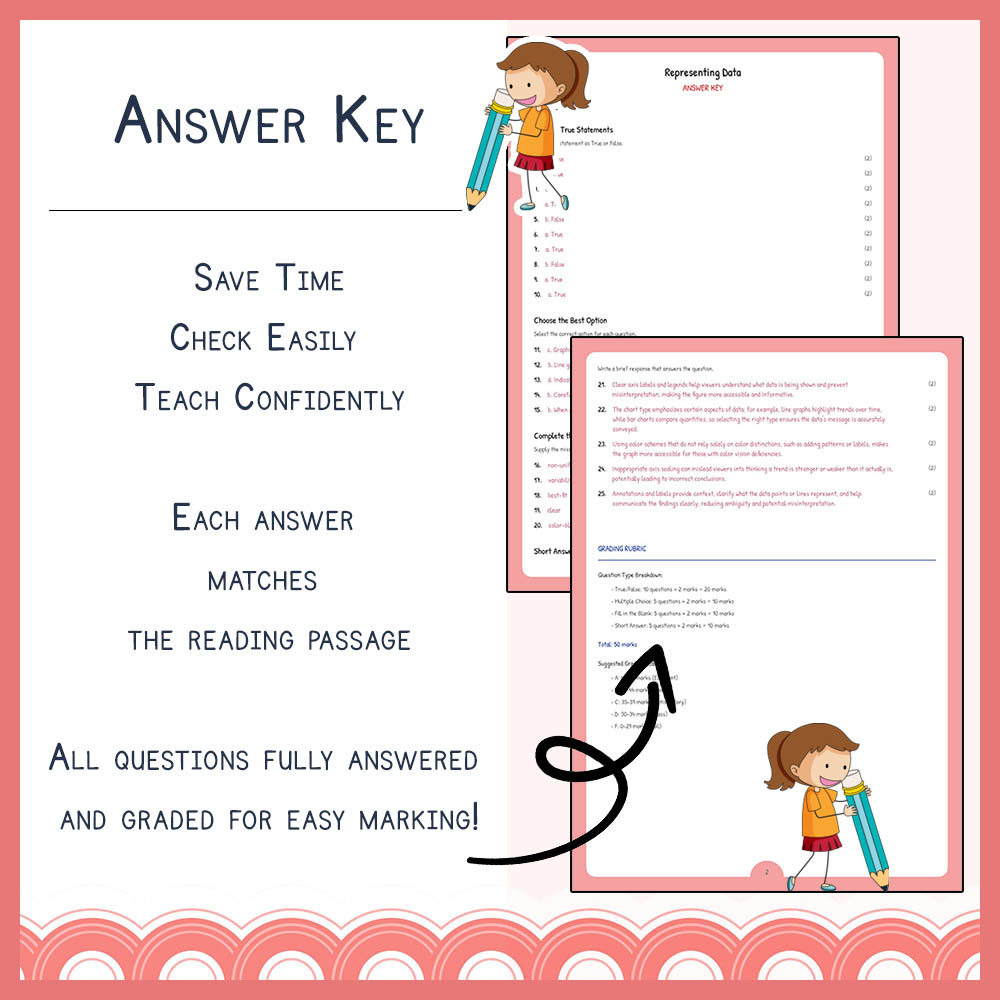
✅ PDF worksheet and PDF answer key with rubric — all in printable format for easy distribution and assessment
Key Concepts Covered
➡️ Data visualization – Understanding how graphical representations communicate scientific data effectively
➡️ Chart types – Recognizing different charts and their suitable applications (bar, line, pie, etc.)
➡️ Data interpretation – Analyzing visual data to identify trends, patterns, and outliers
➡️ Measurement scales – Understanding scales like linear, logarithmic, and their impact on data presentation
➡️ Error analysis – Using error bars and recognizing measurement uncertainty in data displays
Question Types / Formats
1. Reading comprehension passage with related questions
2. True/False statements to evaluate understanding of concepts
3. Multiple choice questions to assess decision-making and knowledge
4. Fill-in-the-blank sentences to reinforce terminology
5. Short answer prompts that require explanation and reasoning
Teacher Benefits
✅ Provides a ready-to-use printable worksheet aligned with Ontario science curriculum standards
✅ Covers a range of question formats to diversify assessment and reinforce learning
✅ Facilitates both classroom instruction and homework tasks for flexible use
✅ The PDF format allows easy printing and distribution for quick implementation
✅ Supports assessment of students' understanding in data analysis and visual literacy skills
Student Benefits
✅ Enhances understanding of data visualization techniques vital for science communication
✅ Develops critical thinking skills through interpretive questions
✅ Improves ability to select appropriate chart types for different data sets
✅ Strengthens vocabulary and terminology related to data presentation
✅ Encourages detailed explanations, fostering scientific reasoning and communication skills
Perfect For
➡️ Classroom instruction on data representation and visualization
✅ Independent practice and homework assignments
➡️ Review sessions focused on scientific communication skills
✅ Group activities promoting discussion of data interpretation
➡️ Assessment preparation for science standards compliance
✅ Use as a quick, print-and-go activity for varied instructional needs
Ready to enhance your Science teaching? Download this dynamic worksheet today and inspire your students to master data representation techniques! 🚀