

Grade 10 Science | Representing Data Worksheet (PDF + Answer Key)
Description
Are you striving to enhance your Grade 10 science classroom with a practical and comprehensive worksheet that builds essential skills in data representation? This worksheet is designed to help students master the crucial techniques of converting complex datasets into clear, meaningful visual formats. Perfect for classroom instruction, this print-ready PDF resource not only strengthens students’ understanding of various chart types, error bars, and data interpretation but also addresses the real challenges teachers face when guiding students through scientific communication.
Why Teachers Love This
✅ Saves valuable preparation time with ready-to-use, high-quality content aligned to curriculum standards
✅ Simple, print-and-go format suitable for immediate classroom use
✅ Designed to reinforce fundamental data representation skills critical for scientific literacy
✅ Fully aligned with Ontario curriculum expectations for Grade 10 science
Why Students Succeed With This
✅ Clear, straightforward instructions that minimize confusion and promote independent learning
✅ Diverse question formats including multiple choice, true/false, fill-in-the-blank, matching, and short answers
✅ Engaging content featuring real-world scenarios that make data visualization relevant
✅ Encourages critical thinking about data presentation and scientific accuracy
What You Get
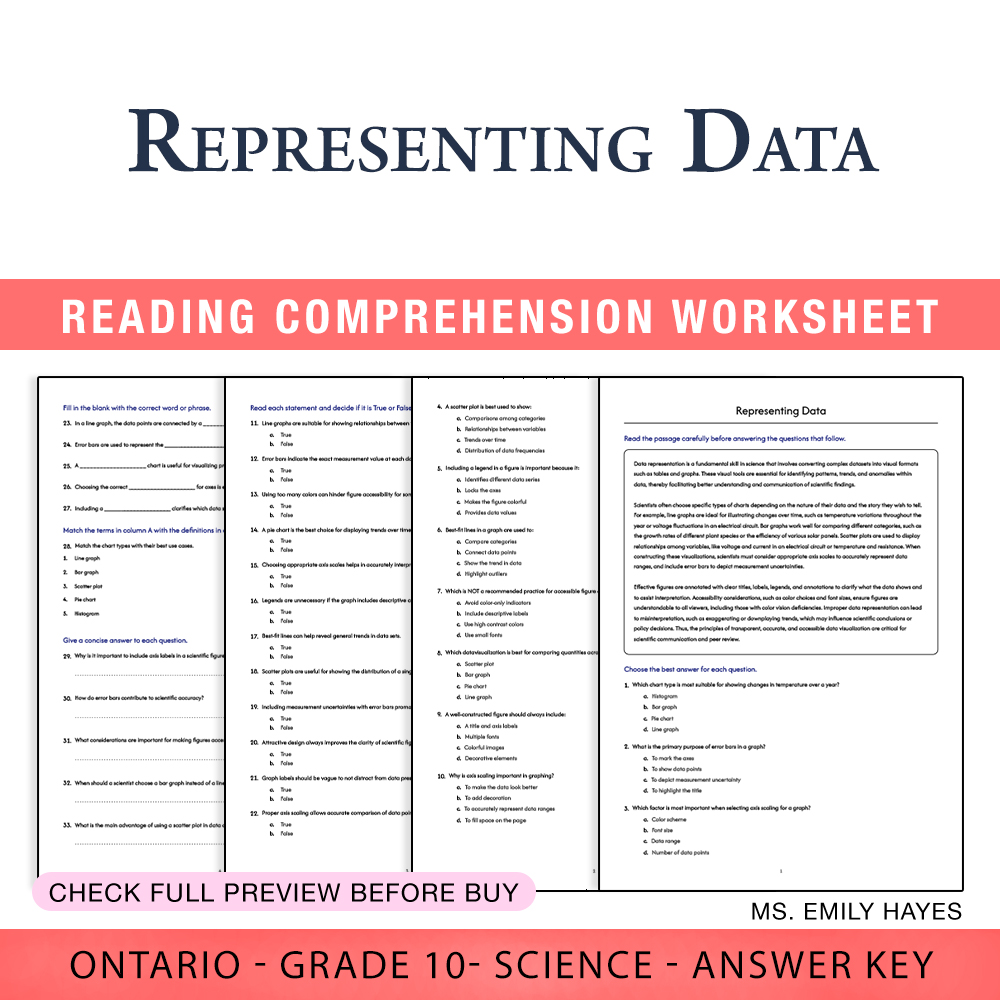
This comprehensive worksheet pack includes a professionally formatted PDF with:
- 6 sections covering key aspects of data representation and analysis
- 1 reading passage explaining fundamental concepts
- 10 multiple-choice questions to assess understanding of chart types and interpretation
- 12 true/false questions to evaluate comprehension of graph features
- 5 fill-in-the-blank exercises reinforcing terminology and process
- 1 matching activity to connect chart types with appropriate use cases
- 5 short-answer questions promoting critical thinking about data visualization
- 2 essay-style questions for deep analysis of effective data presentation and accessibility
Accompanying the worksheet is a PDF answer key with detailed rubric, designed to streamline grading and provide clear assessment criteria. This resource is ideal for in-class activities, homework, review sessions, or assessment prep, ensuring students develop vital skills in scientific data communication.
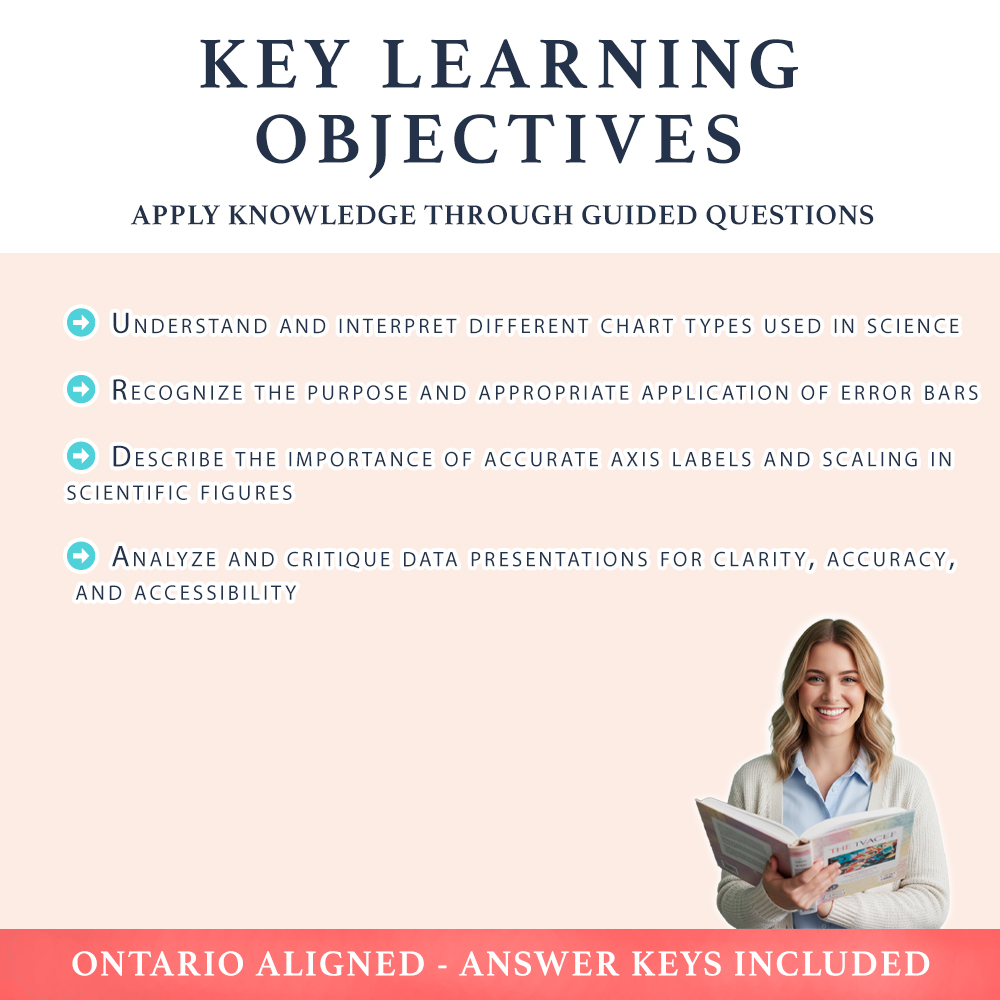
Key Learning Objectives
Students will be able to:
➡️ Understand and interpret different chart types used in science
➡️ Recognize the purpose and appropriate application of error bars
➡️ Describe the importance of accurate axis labels and scaling in scientific figures
➡️ Analyze and critique data presentations for clarity, accuracy, and accessibility
Ideal Usage
This worksheet is perfect for classroom practice, formative assessment, or reinforcement activities. It’s suitable for whole-class lessons, small-group work, or independent study. The ready-to-print PDF format makes it easy to incorporate into lesson plans without any additional setup, providing immediate value to busy educators looking for high-quality, standards-aligned materials.
Empower your students to master the vital skill of data representation with this comprehensive worksheet. Prepare them to analyze, interpret, and communicate scientific data confidently — essential abilities for success in upper-level science and beyond! 🚀