Grade 6 Science – Data Representation Worksheet for Mastery
Description
Imagine your classroom as students dive into the important world of data in science. They’re learning how to gather, analyze, and interpret information through reading passages and supporting questions. This scene is familiar: students are puzzled over how to organize data effectively or which graph best illustrates their findings. This worksheet provides a straightforward solution, offering clear exercises that help students develop essential skills in data representation, all within a printable, ready-to-use PDF format. With this resource, you can guide your students step-by-step in understanding data collection, analysis, and graphical display, all crucial components in scientific investigations.
What This Resource Helps Students Do
Through this worksheet, students strengthen their ability to interpret data, understand different forms of data display, and analyze scientific information with confidence. The reading passage introduces important concepts and contextualizes the use of data recording, making abstract ideas more understandable. The multiple-choice questions are crafted to promote critical thinking about data types, purposes, and visualization methods. As they work through the exercises, students build independence by applying their understanding in various scenarios, reinforcing their capacity for scientific reasoning and data literacy in preparation for more complex investigations.
Inside the PDF
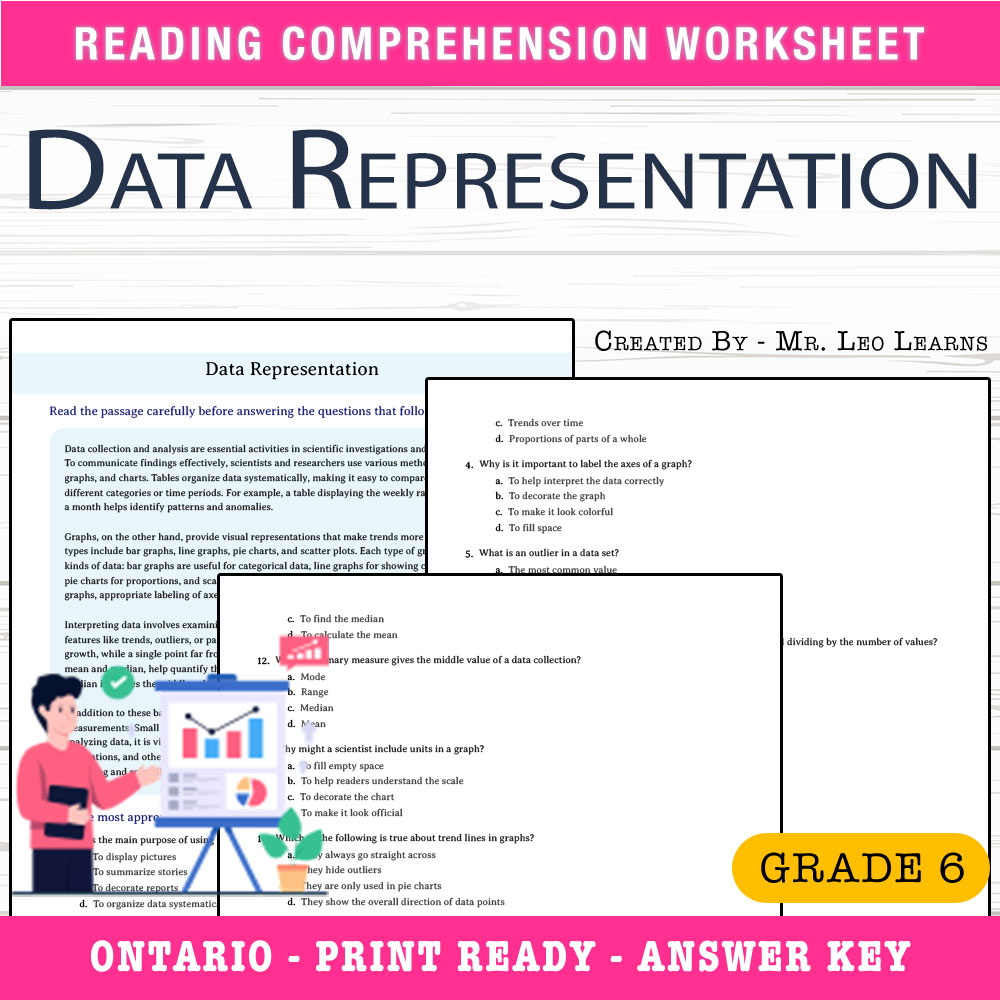
• 1 engaging reading passage encouraging comprehension of data collection and analysis techniques
• 25 multiple-choice questions designed for structured, incremental learning
• A print-ready format requiring no additional preparation from teachers
• Clear layout optimized for easy photocopying and classroom use
• An answer key with rubric for quick formative assessment and review
How It Improves Learning
This worksheet supports a gradual understanding of data representation by guiding students through reading, questioning, and analyzing activities designed for clarity and reinforcement. The reading passage sparks engagement with real-world examples, making abstract concepts tangible. The multiple-choice questions reinforce key ideas, encouraging students to think critically about the purpose and types of data displays, such as tables and graphs. This structure helps students move from initial confusion to a confident understanding of how different graphic tools serve specific purposes. The answer key provides immediate feedback, enabling students to self-assess and teachers to identify areas needing further review. Overall, this resource fosters independent thinking, enhances data literacy, and builds student confidence in scientific reasoning.
Core Skills Students Will Develop
- ➡️ Data collection and analysis
- ➡️ Understanding graphs and tables
- ➡️ Scientific reasoning and interpretation
- ➡️ Critical thinking about data presentation
Ways Teachers Use This Worksheet
This worksheet can be utilized in various ways: as classwork to introduce students to data representation fundamentals, as homework to reinforce concepts learned during instruction, or as an assessment tool to gauge understanding. It’s also useful for small-group activities where students collaborate on analyzing data, or as early finisher work for students who quickly complete their assignments. Teachers may incorporate it into review sessions before tests or as a part of project-based learning activities. Its straightforward, print-and-go format makes it easy for teachers to implement effortlessly, providing a reliable resource that fits seamlessly into science lessons focused on data in the physical and life sciences.
Why This PDF Saves Time
This printable worksheet offers value by eliminating the need for extensive preparation. With all questions and the answer key included in a clear, ready-made PDF, teachers can print and distribute the resource immediately. The layout’s efficiency ensures quick photocopying and straightforward classroom management, allowing more time to focus on instruction rather than planning. The consistent, print-ready format promotes uniformity in assessments and classroom activities, helping teachers maintain clarity and organization throughout their science units.
Designed with educators in mind, this worksheet is a practical, classroom-ready tool to support student learning about data representation. It’s built to foster confidence, develop core skills, and deepen understanding of scientific data without adding extra work for teachers. Your students are ready to explore data analysis with this accessible, comprehensive resource — simply print, distribute, and watch their understanding grow! 😊