Grade 6 Science | Graph Selection Worksheet | Alberta | Data Analysis Skills
Description
Are your Grade 6 students exploring data analysis and graph interpretation?
🌿 This Worksheet Elena is designed to build understanding of key graph concepts aligned with Alberta science standards. It provides structured practice to improve students' ability to select, interpret, and create various types of graphs essential for scientific data presentation.
What's Included
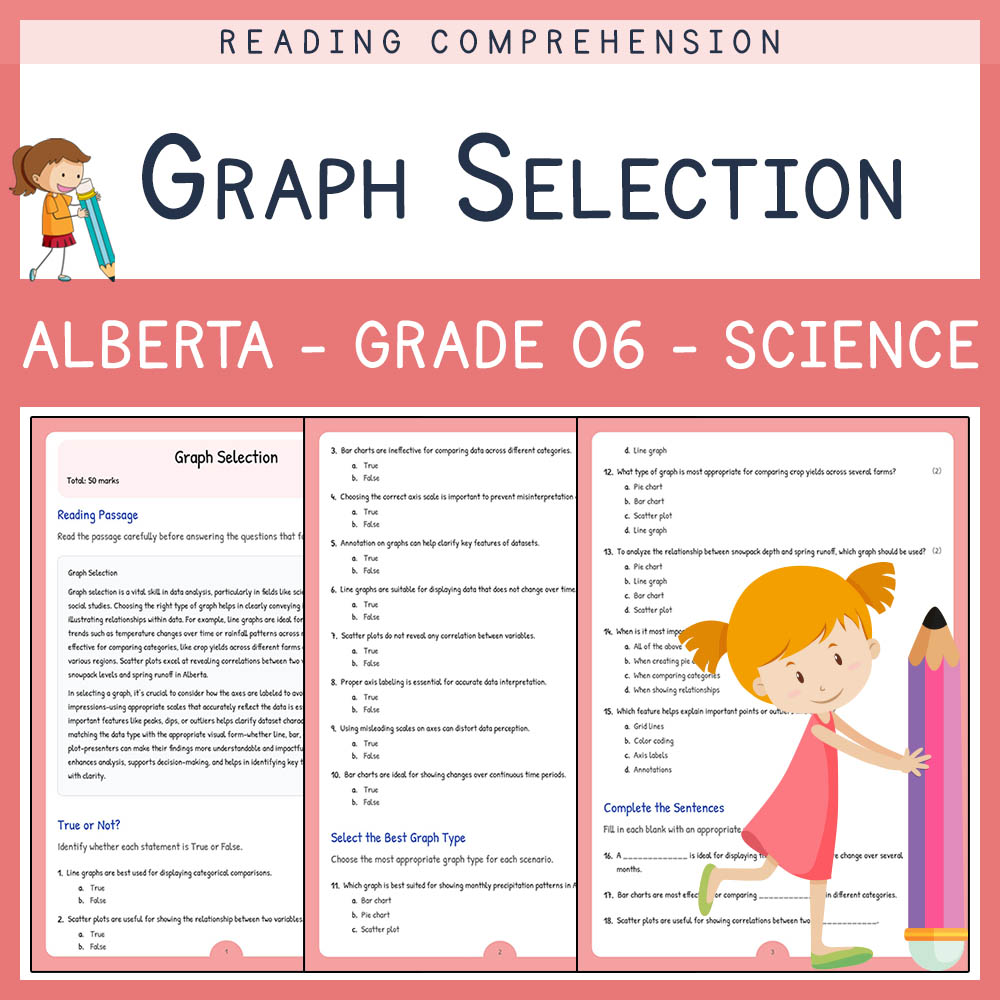
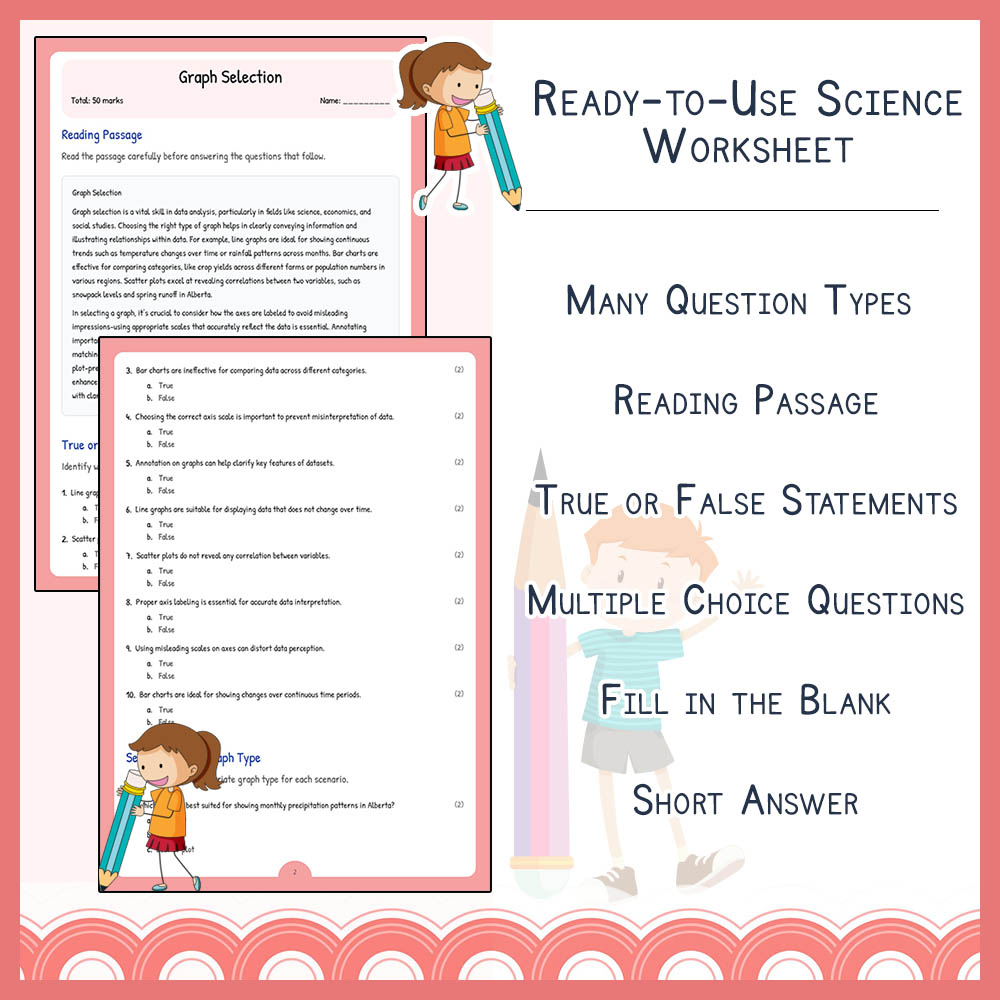
✅ Reading passage explaining the significance of graph selection and data analysis
✅ 10 true or false questions to assess understanding of graph types and their uses
✅ 5 multiple-choice questions to identify the most suitable graph for specific data sets
✅ 5 fill-in-the-blank sentences focused on graph applications and terminology
✅ 5 short response questions encouraging explanation of data interpretation and graphing importance
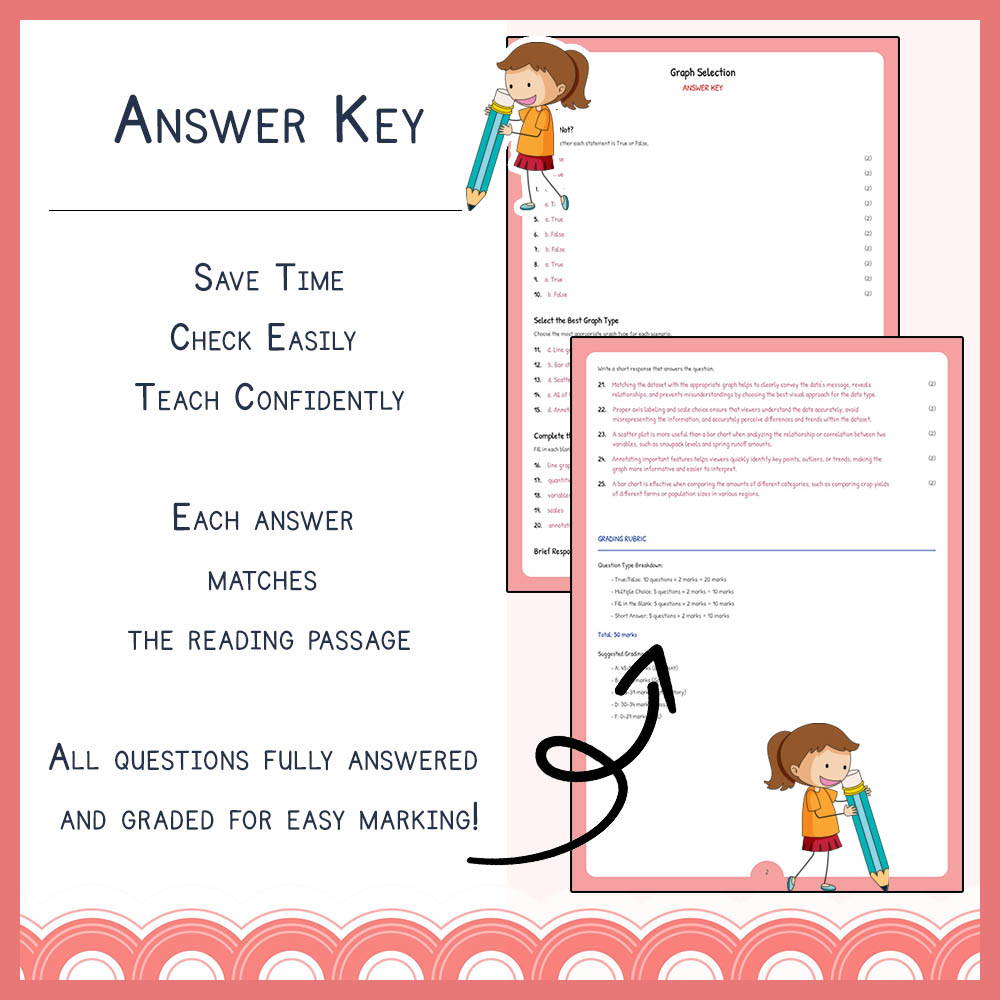
✅ PDF worksheet and PDF answer key with rubrics for easy assessment and grading
✅ Printable format for straightforward classroom use, homework, or review sessions
Key Concepts Covered
➡️ Graph types and functions – Understanding various graphs such as line graphs, bar charts, scatter plots, and pie charts
➡️ Data representation – Recognizing appropriate graph choices for different data sets and scenarios
➡️ Interpretation skills – Analyzing and drawing conclusions from data visualizations
➡️ Best fit graph selection – Matching data with the most effective graph type for clear communication
➡️ Data communication – Learning how labeling, scale, and format influence data understanding
Question Types / Formats
1. Reading comprehension with questions based on a provided passage
2. True or false statements to assess conceptual understanding
3. Multiple-choice questions for graph type identification
4. Fill-in-the-blank sentences to reinforce terminology and applications
5. Short answer to develop reasoning and explanation skills
Teacher Benefits
✅ Simplifies lesson planning with ready-to-use printable PDFs
✅ Facilitates clear assessment of student understanding and mastery
✅ Covers key curriculum standards aligned with Alberta Grade 6 science
✅ Supports diverse learning styles with varied question formats
✅ Easy to print and distribute for quick classroom implementation
Student Benefits
✅ Strengthens understanding of data visualization and graph interpretation
✅ Develops critical thinking related to data presentation
✅ Enhances analytical skills through practical application
✅ Prepares students for real-world data analysis tasks
✅ Builds foundational skills for more advanced scientific inquiry
Perfect For
➡️ Classroom instruction focused on data analysis and graphing
✅ Homework assignments to reinforce lesson concepts
➡️ Review sessions and formative assessment activities
✅ Substitute teacher plans requiring easy-to-implement activities
➡️ Extra practice for students needing additional support with graphing skills
Ready to enhance your Science teaching? Download this dynamic worksheet today and inspire your students to master data analysis and graph selection! 🚀