Grade 6 Science — Graph Selection Worksheet MCQ Paper for Mastery
Description
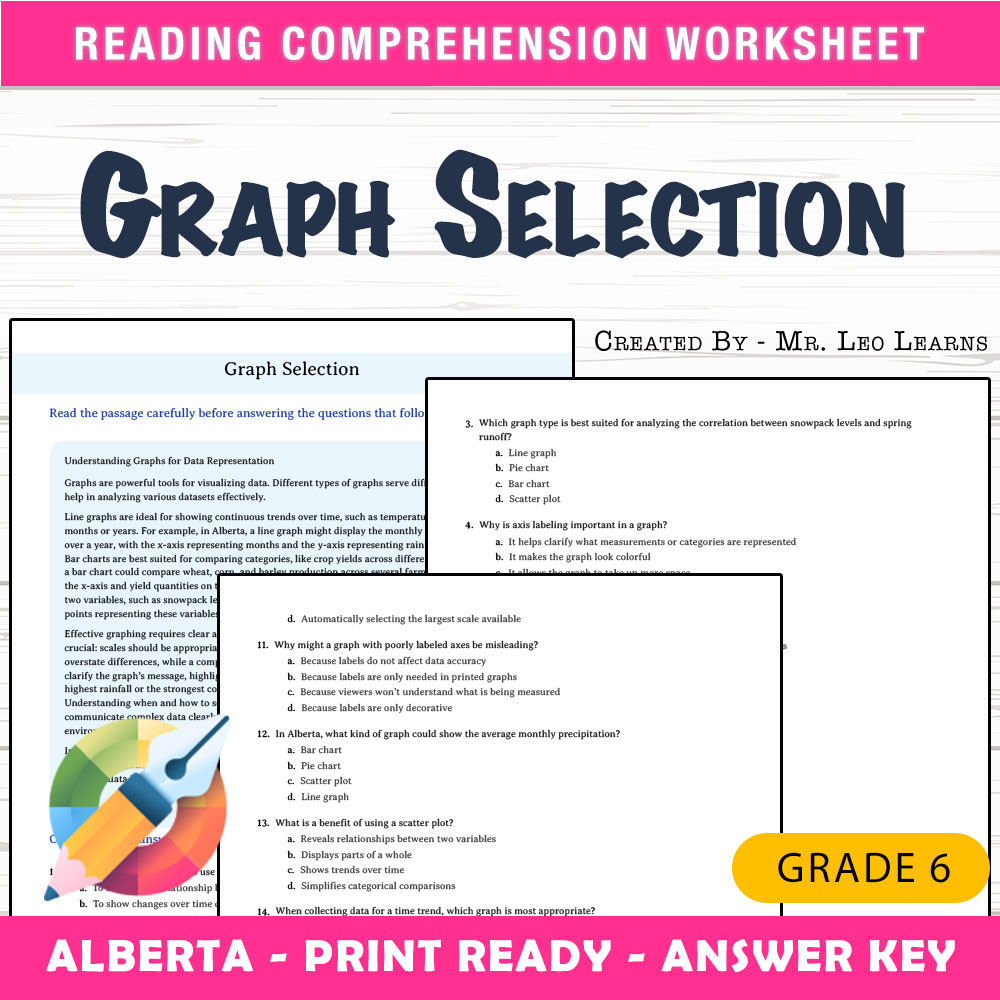
Imagine walking into your classroom and seeing students eager to analyze data, but feeling uncertain about choosing the correct types of graphs for different situations. This common challenge can be eased with a clear, focused worksheet that guides students through understanding graphs and their purposes. The Graph Selection Worksheet MCQ Paper provides a straightforward, print-ready resource designed to reinforce students' ability to identify and select appropriate graph types based on real-world data scenarios.
What This Resource Helps Students Do
This worksheet actively guides students in developing their understanding of various types of graphs, such as line graphs, bar charts, and pie charts. Through a reading passage and multiple-choice questions, students learn to interpret data presentation methods and make informed decisions about which graph best suits specific data sets. The questions are structured to challenge reasoning skills and encourage students to analyze visual data critically. As they practice, they build confidence in their ability to select appropriate graph types, a key skill in data literacy and scientific communication.
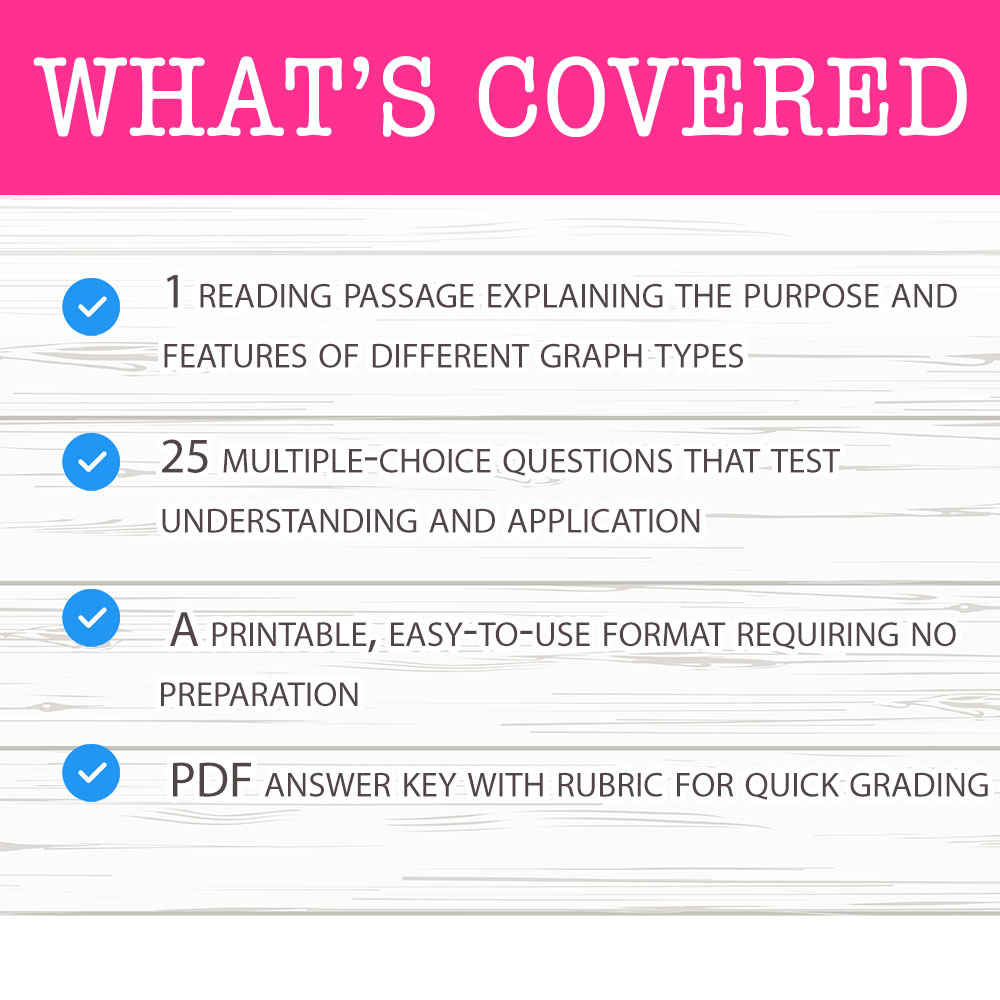
Inside the PDF• 1 reading passage explaining the purpose and features of different graph types
• 25 multiple-choice questions that test understanding and application
• A printable, easy-to-use format requiring no preparation
• PDF answer key with rubric for quick grading
• Designed layout for easy photocopying and seamless classroom use
This worksheet enhances learning by providing students with a clear, structured way to analyze data visualization tools. The reading passage sets a solid foundation, helping students understand why different graphs are used. The multiple-choice questions encourage them to apply their knowledge to realistic situations, fostering critical thinking and reasoning skills. As students work through each question, they develop confidence in their ability to identify the most effective graph type for a given data set. This step-by-step practice helps reinforce understanding, reduces confusion, and makes complex concepts accessible. Teachers can use this worksheet to assess comprehension and provide targeted feedback, ensuring that students grasp the underlying principles of data representation.
Core Skills Students Will Develop- → Interpreting data visualizations
- → Understanding different types of graphs
- → Selecting appropriate graph types based on data
- → Critical thinking for data communication
Many teachers incorporate this worksheet into their lessons as a class activity, assigning it as individual or small-group work to reinforce learning after a lesson on data visualization. It works well as a quick assessment tool to gauge understanding or as a follow-up to a hands-on classroom demonstration. The worksheet is also practical for homework, providing students with additional practice outside of class. Additionally, it can serve as early finisher work or as a review activity during assessments, supporting ongoing mastery of scientific graphic communication skills.
Why This PDF Saves TimeDesigned for immediate use, this PDF offers a print-and-go solution that saves planning time. Its clear layout and straightforward format make copying easy, allowing teachers to focus on facilitating discussion rather than preparing materials. The included answer key streamlines grading, making it simple to evaluate student understanding quickly and consistently. Overall, this resource provides a reliable, ready-to-use tool that supports effective instruction without extra prep.
In summary, this worksheet is a practical, classroom-friendly resource built to help students master the skill of selecting appropriate graphs for different data types. Fully prepared and easy to implement, it supports confidence building, critical thinking, and comprehension—making data representation an accessible and engaging part of your science lessons. 😊