Grade 7 Science Assessment | Graphical Representation Worksheet | Ontario
Description
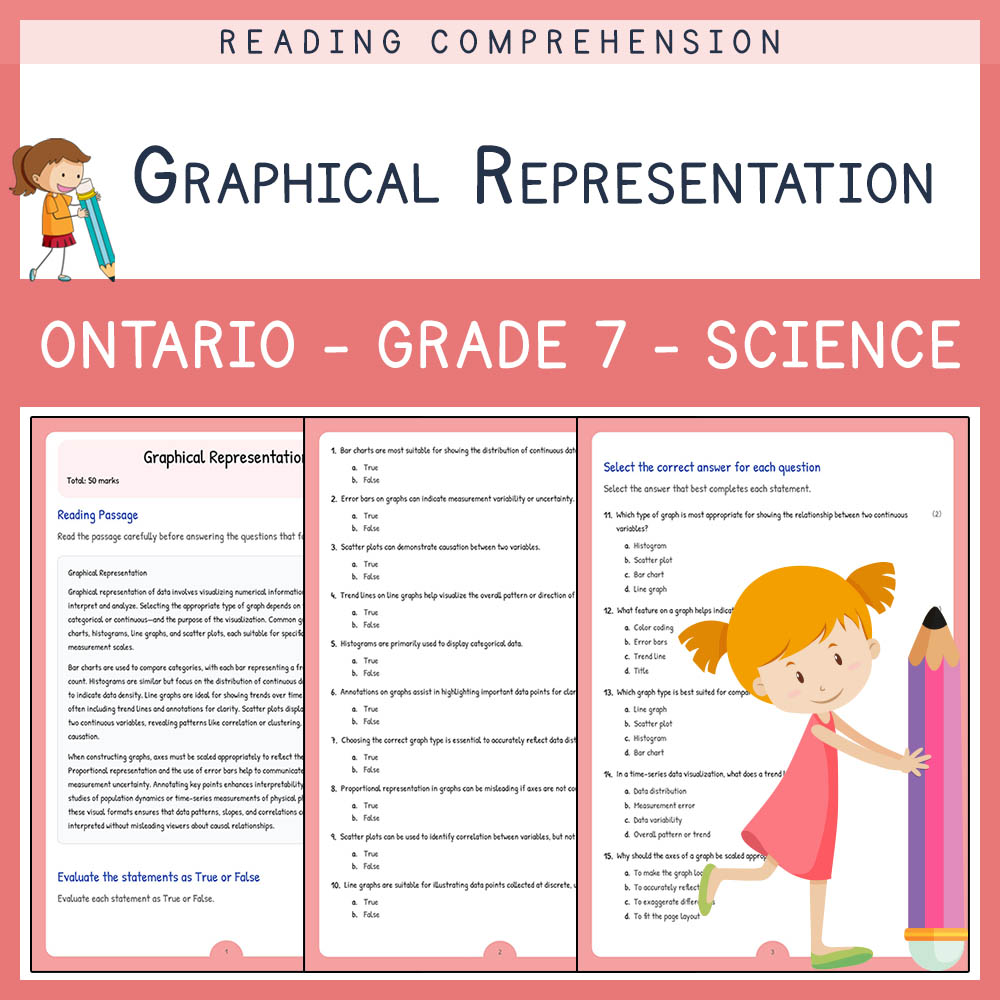
Are your Grade 7 students exploring data visualization and graphing techniques? This engaging worksheet is designed to deepen their understanding of graphical representation of data, aligned with Ontario science standards. Perfect for reinforcing concepts learned in class, this resource helps students develop critical skills in interpreting, analyzing, and creating various types of scientific graphs and charts.
What's Included
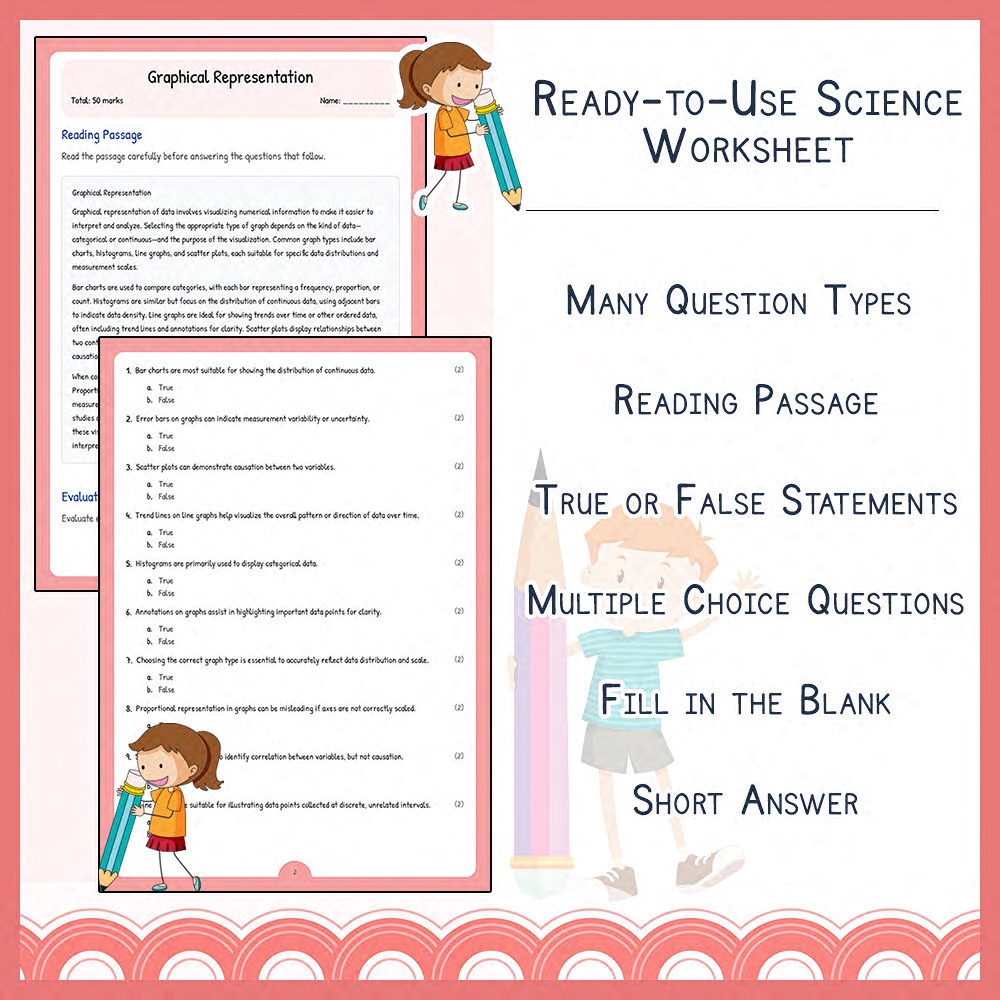
✅ Reading passage with comprehension questions
✅ Evaluate statements as True or False questions (10 items)
✅ Multiple-choice questions (5 items) for identifying appropriate graph types and features
✅ Fill-in-the-blank questions (5 items) to reinforce understanding of graph construction principles
✅ Short answer questions (5 items) encouraging explanation of graphing concepts
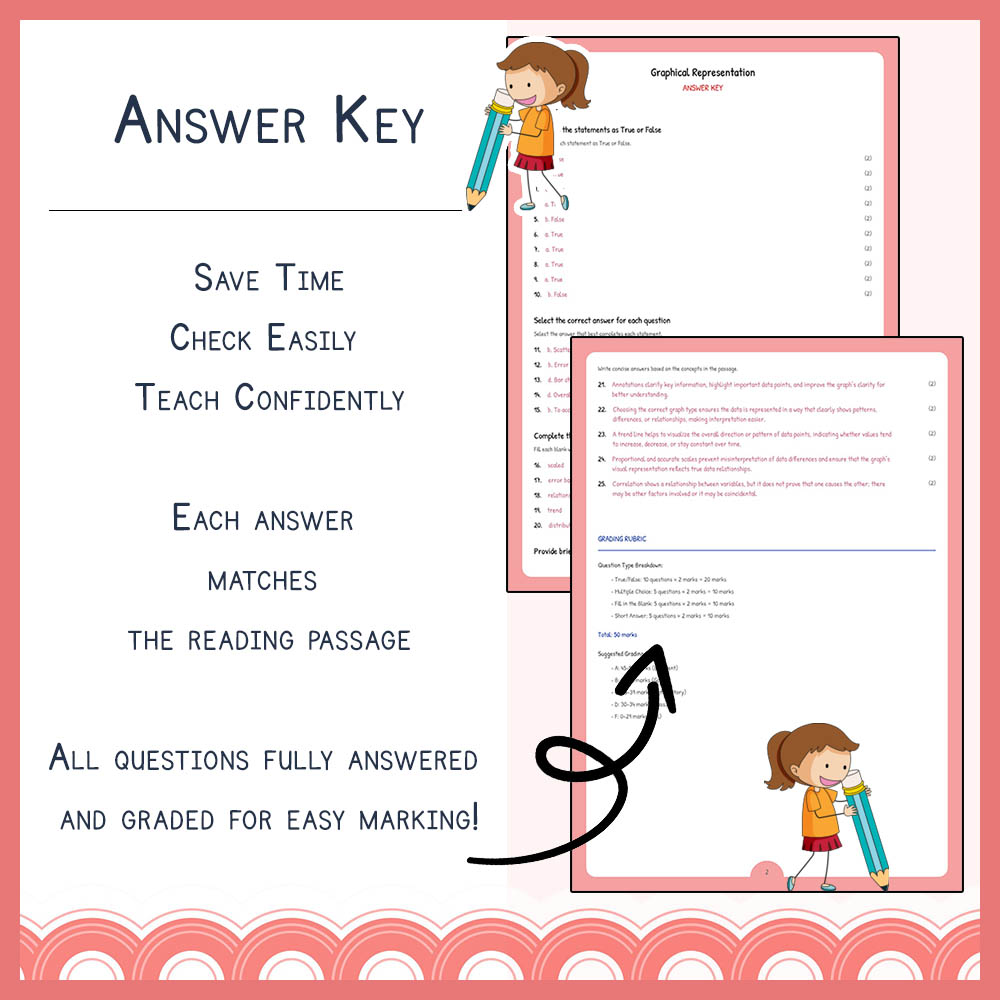
✅ PDF worksheet and PDF answer key with rubric for easy printing and grading
✅ Clearly organized sections to streamline lesson planning and student practice
Key Concepts Covered
➡️ Graphical data interpretation – Understanding how visualizing data aids in analysis and communication
➡️ Types of graphs – Recognizing and selecting appropriate graphs like bar charts, line graphs, and scatter plots
➡️ Error bars and variability – Learning how measurement uncertainty is represented visually
➡️ Graph construction principles – Ensuring axes, scales, and labels are properly used for clarity
➡️ Data annotation and interpretation – Annotating graphs effectively to convey findings and insights
Question Types / Formats
1. Reading comprehension passage followed by open-ended questions
2. True or False evaluations to test conceptual understanding
3. Multiple-choice questions to identify correct graph features and appropriateness
4. Fill-in-the-blank questions reinforcing technical terms and best practices
5. Short answer prompts encouraging explanation and critical thinking
Teacher Benefits
✅ Provides a comprehensive, standards-aligned assessment tool to evaluate student understanding
✅ Facilitates printable, easy-to-distribute worksheets for in-class or homework use
✅ PDF format ensures high-quality, professional-looking materials ready for immediate use
✅ Supports differentiated instruction by offering varied question formats and difficulty levels
✅ Enhances lesson planning with ready-made assessment components aligned with Ontario science standards
Student Benefits
✅ Develops critical thinking skills through interpretation and analysis of visual data
✅ Reinforces understanding of graph types, construction, and data variability
✅ Encourages clear communication of scientific information via appropriately labeled graphs
✅ Builds confidence in data presentation and analysis tasks
✅ Promotes independent problem-solving using a variety of question formats designed for mastery
Perfect For
➡️ Classroom instruction on data visualization and graphing techniques
✅ Homework assignments that reinforce lesson concepts
➡️ Quizzes and formative assessments to gauge student progress
✅ Science projects requiring data analysis and presentation
➡️ Substitutes or review sessions to keep students engaged with key concepts
Ready to enhance your Science teaching? Download this dynamic worksheet today and inspire your students to master data representation and visualization! 🚀