
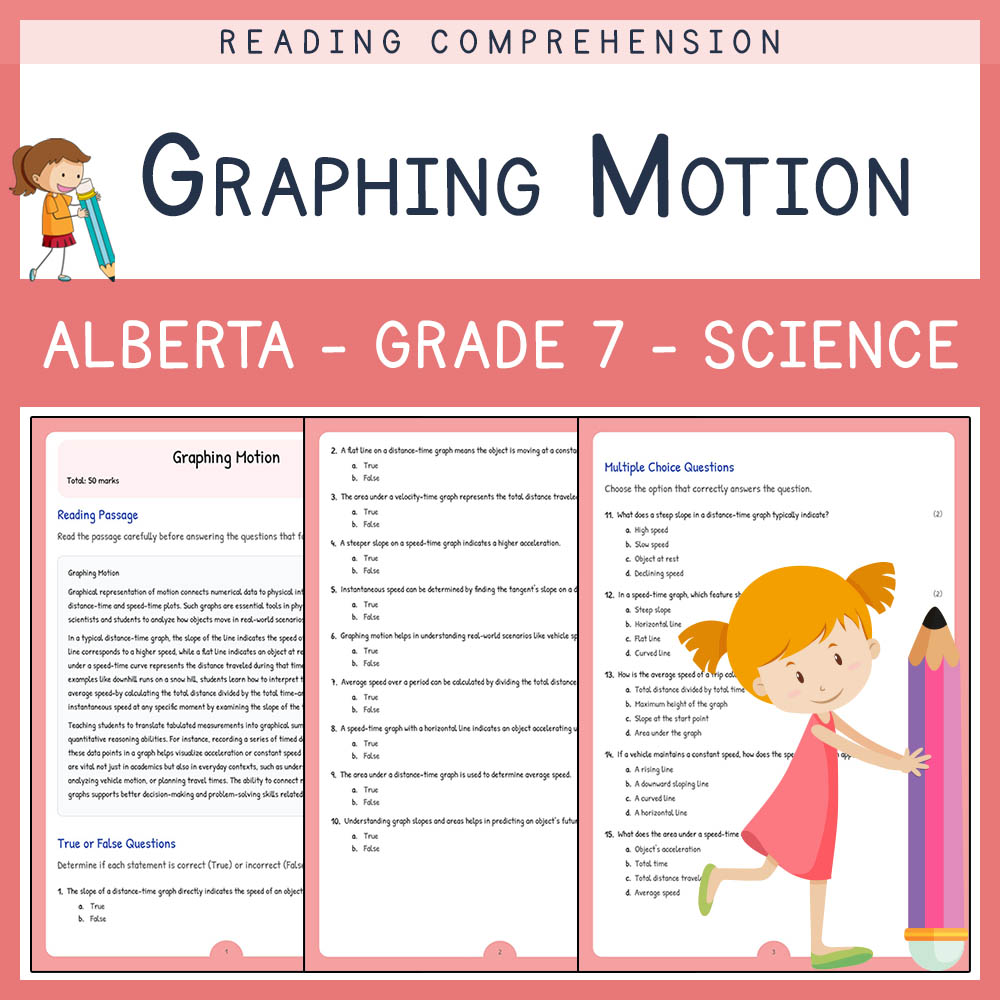
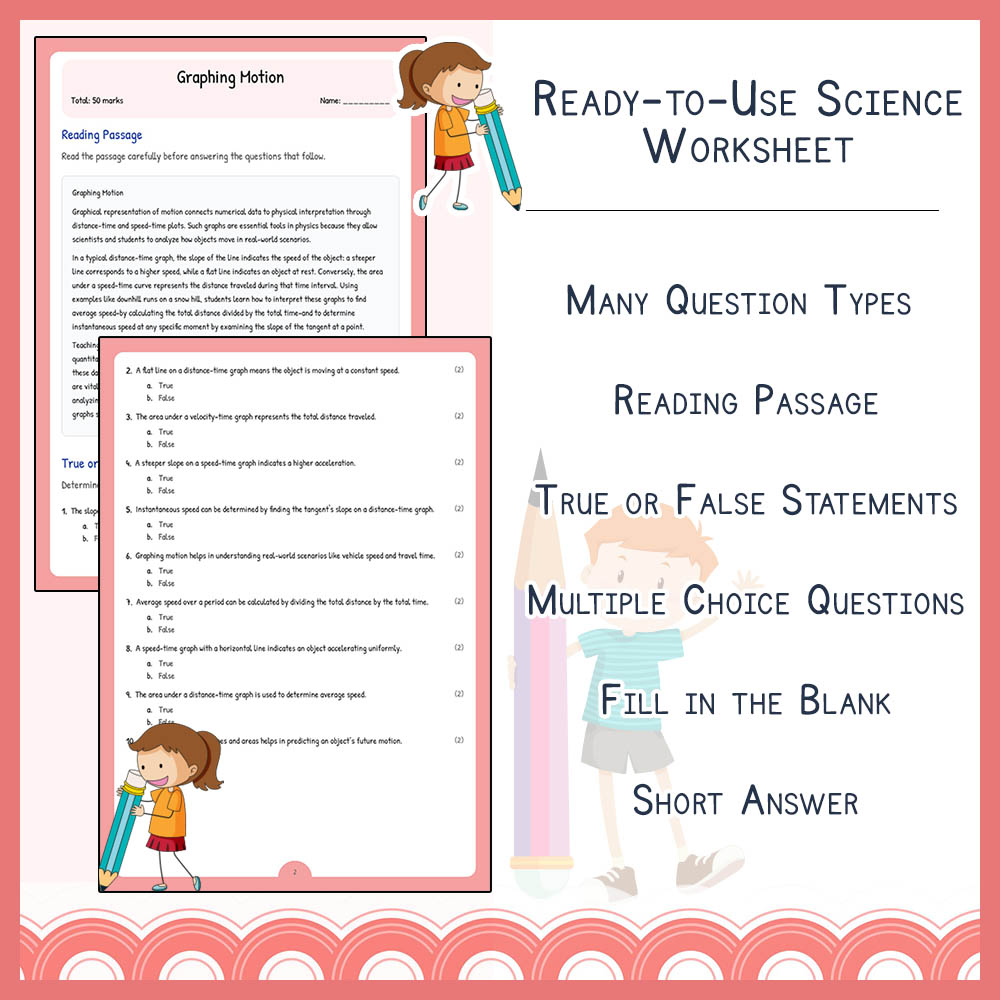
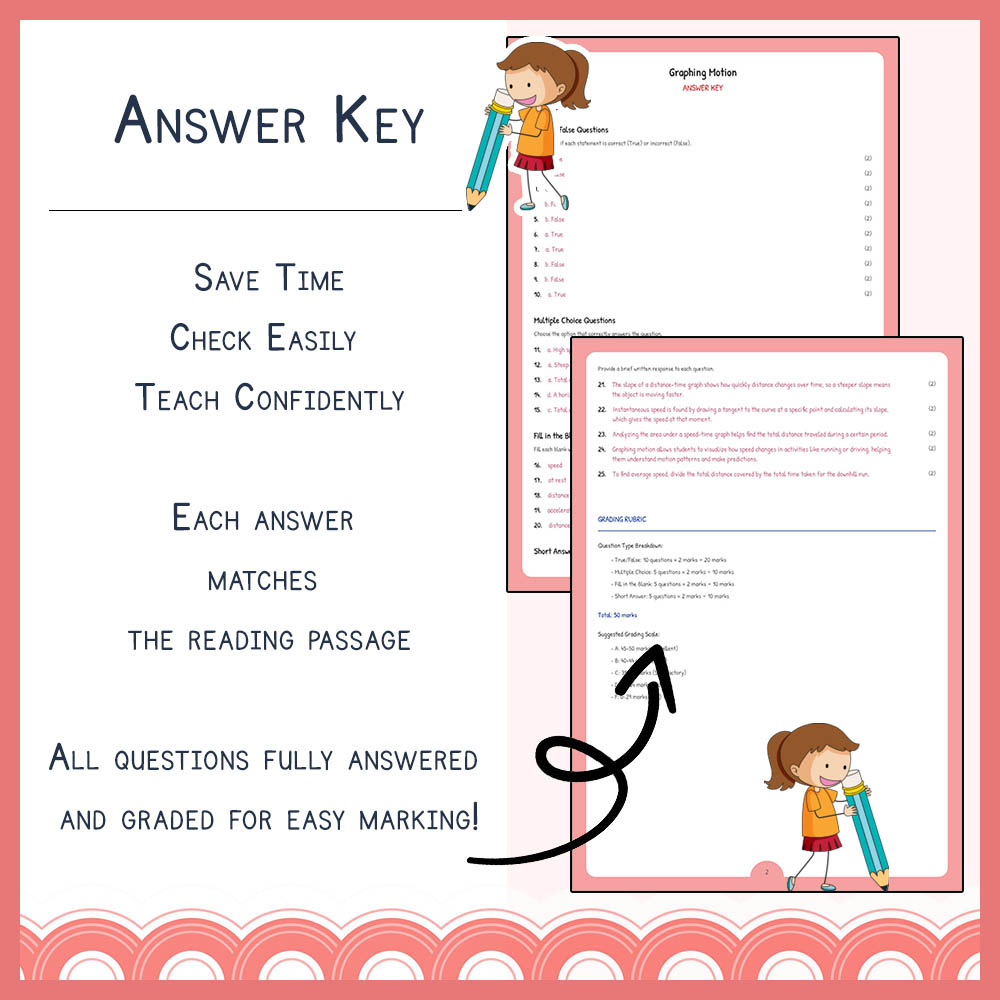
Grade 7 Science Assessment | Graphing Motion Worksheet | Alberta
$3.00
Lumora Learning
·3 followers·12 sales
SubjectScienceGradeGrade 7
Learning Objectives
Understand how to represent motion visually through distance–time and speed–time graphs.
Interpret slope meanings in motion graphs to determine speed and rate of change.
Learn methods to calculate average and instantaneous speeds from graphs.
Reviews & Feedback
Loading reviews...
Questions & Answers
Loading questions…
About this worksheet
Related categories
Frequently asked questions
Who is Grade 7 Science Assessment | Graphing Motion Worksheet | Alberta designed for?
Grade 7 Science Assessment | Graphing Motion Worksheet | Alberta is designed for Grade 7 students and Science learners and can be used in classrooms, homeschool, or independent practice.
How do I download Grade 7 Science Assessment | Graphing Motion Worksheet | Alberta ?
Add it to your cart and complete checkout. After payment, you can download immediately from your account, and you'll also receive a download link by email.
What type of worksheet is this?
Grade 7 Science Assessment | Graphing Motion Worksheet | Alberta is a worksheet elena worksheet for Science, suitable for Grade 7 level.
Similar Products

Graphing Motion Assessment | Alberta Standards Grade 7 Science
$5.00

Grade 7 Science Worksheet on Motion Graphs | TEKS Practice and Assessment
$2.00

Grade 7 Science Graphing Motion Worksheet – Alberta Standards (PDF)
$4.00

Motion Graphs Assessment for Grade 10 Science | Standards-Aligned Assessment
$5.00

Motion Graphs Worksheets: Interpreting Graphs | Grade 9 Science
$3.00