Grade 7 Science – Data Representation Worksheet for Mastery
Description
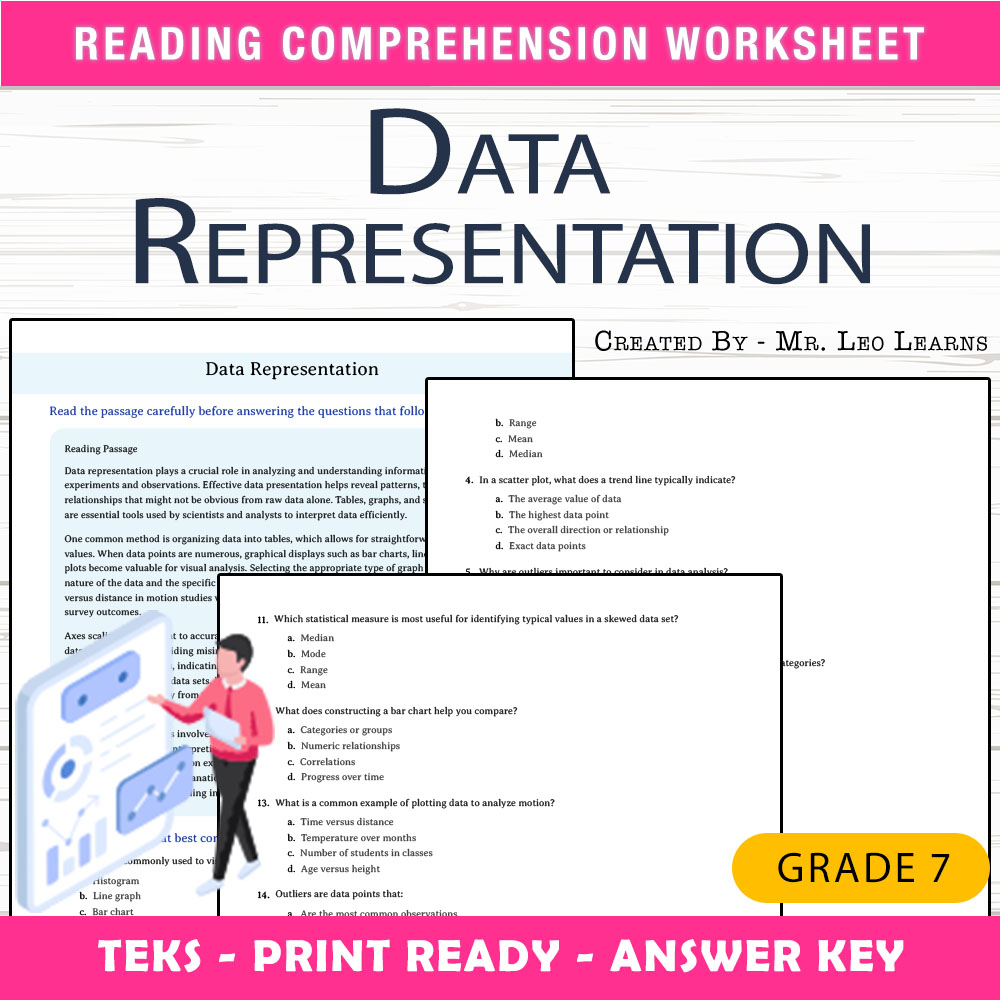
In a busy classroom, it's common for students to feel overwhelmed when trying to understand how to interpret and analyze data. Whether they're working on understanding different types of data displays or learning how to communicate findings effectively, this delicate process can sometimes lead to confusion. This Grade 7 Science worksheet on Data Representation provides a straightforward, print-and-go solution designed to build confidence and clarity. It guides students through key concepts of data visualization, making abstract ideas more accessible and helping them develop essential skills for analyzing scientific data.
What This Resource Helps Students Do
This worksheet helps students develop the ability to interpret various data representations accurately, such as graphs and charts. It supports independent practice by walking students through reading, analyzing, and drawing conclusions from data displays. As students complete the questions, they reinforce their understanding of the purpose and interpretation of different types of data representations, ultimately improving their ability to communicate scientific information clearly and effectively. The structured questions are designed to scaffold learning, enabling students to progress from basic comprehension to more analytical thinking, paving the way for success in science assessments and real-world applications.
Inside the PDF
• 25 carefully crafted questions that guide students step by step through understanding data representation
• A printable, print-ready format requiring no additional preparation
• An answer key with a rubric to support predictable grading
• Layout designed for easy photocopying and classroom distribution
How It Improves Learning
This worksheet emphasizes clarity by breaking down complex concepts into manageable questions, gradually building students' confidence. The variety of question types, including reading passages and multiple-choice questions, encourages active engagement and critical thinking. Students strengthen their skills as they learn to identify the purpose of different data tools, understand axes scaling, and interpret trends. The guided nature of the questions helps students move from initial confusion to clear comprehension, fostering independent reasoning skills essential for science mastery. Teachers appreciate how the straightforward format streamlines instruction, saving time and ensuring consistent practice across the classroom.
Core Skills Students Will Develop
- ➡️ Understanding different types of data representations
- ➡️ Interpreting graphs and charts accurately
- ➡️ Analyzing data trends and relationships
- ➡️ Communicating scientific data effectively
Ways Teachers Use This Worksheet
Many teachers incorporate this worksheet into their lessons as a valuable classwork resource or homework assignment, allowing students to reinforce concepts introduced during instruction. It also serves well during small-group work or as an assessment review to gauge understanding. Additionally, teachers may utilize it as an early finisher activity or a reinforcement tool after explaining data representation concepts, providing structured practice that supports varied learning paces in the classroom.
Why This PDF Saves Time
This resource offers a straightforward, print-ready format that significantly reduces preparation time. Because it requires no extensive setup, teachers can easily distribute it for immediate use. Its consistent, organized layout ensures uniformity in student practice and makes grading more efficient. Having a dependable worksheet and answer key on hand helps maintain a smooth instructional flow without last-minute planning, so teachers can focus on supporting student understanding during class.
With this printable Data Representation worksheet, teachers can confidently facilitate meaningful practice that helps students interpret and communicate data with clarity. It is ready to print and distribute, making classroom management easier and learning more effective. Your students will develop stronger visualization and analysis skills that are vital for success in science and beyond. 📚