Grade 7 Science | Data Representation Worksheet | TEKS Alligned
Description
Are your Grade 7 students exploring the fundamentals of data analysis and visual representation?
🌿 This comprehensive worksheet, aligned with TEKS standards, helps students develop essential skills in organizing, interpreting, and presenting scientific data. Crafted for educators seeking effective assessment tools, this PDF worksheet and answer key provides a structured approach to teaching data representation concepts in a clear, engaging way.
What's Included
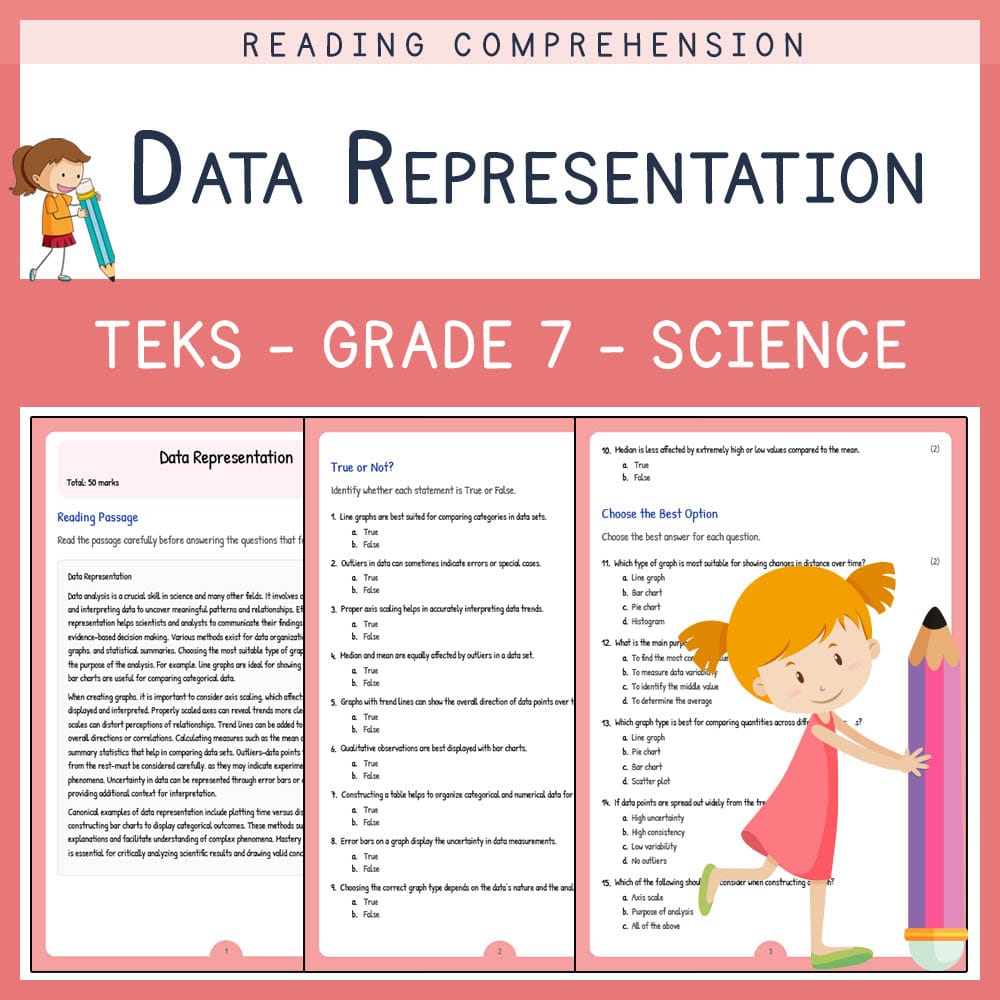
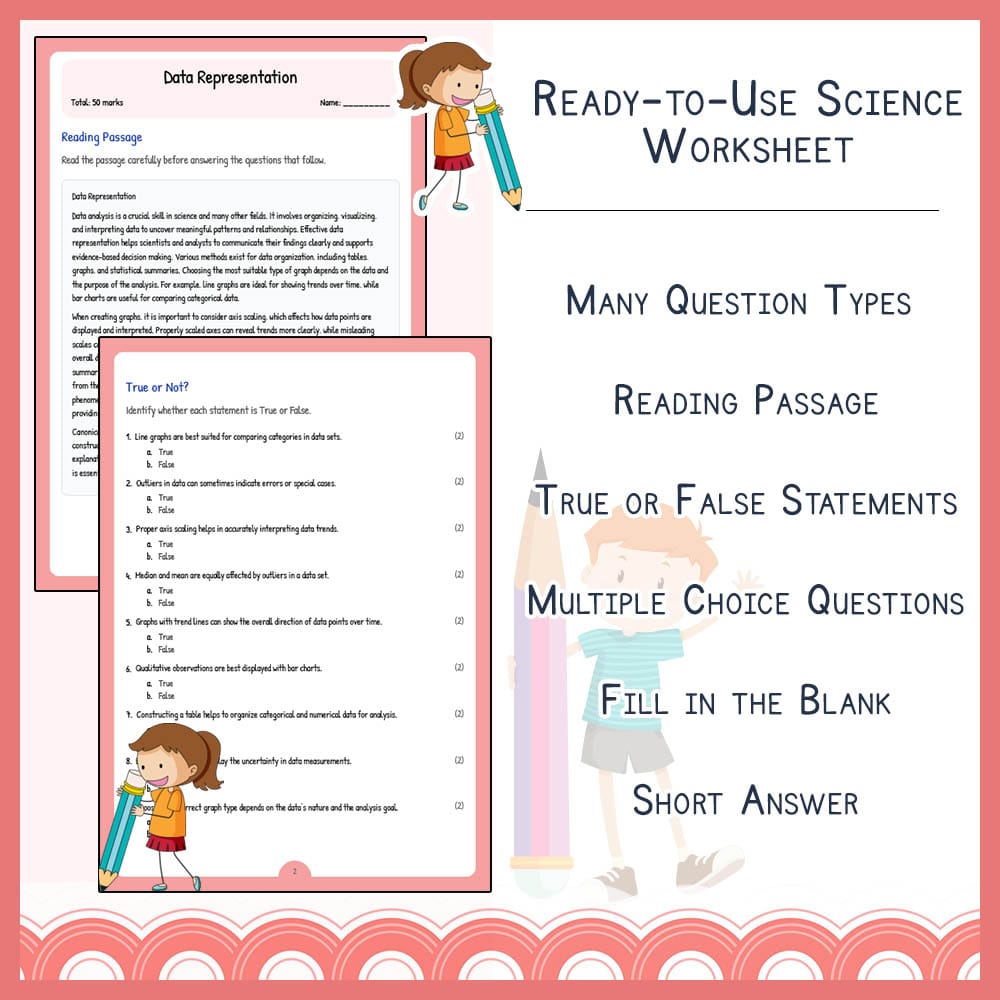
✅ Reading passage that introduces the importance of data analysis in science and real-world applications
✅ 10 true or false questions to assess foundational understanding
✅ 5 multiple-choice questions focusing on graph types and data interpretation
✅ 5 fill-in-the-blank exercises to reinforce key terminology
✅ 5 short response questions encouraging critical thinking and explanation
✅ PDF worksheet with all questions formatted for easy printing
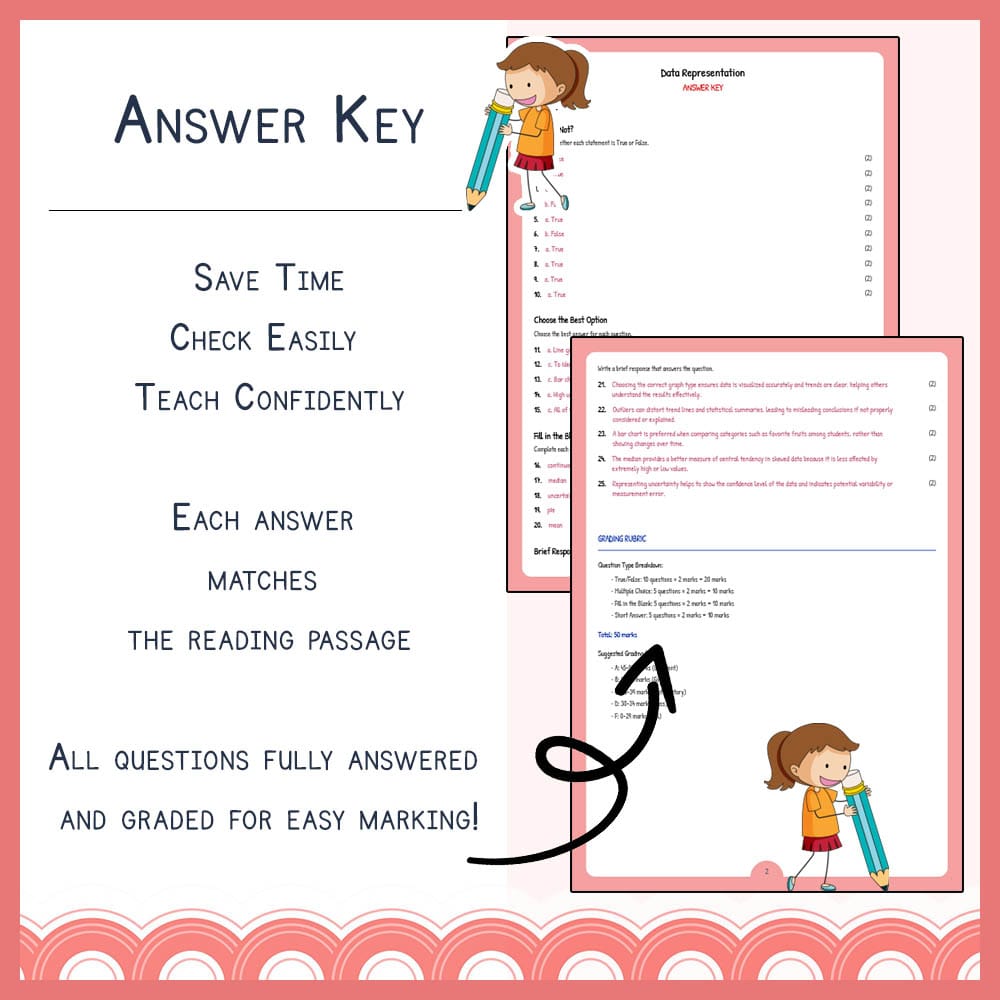
✅ PDF answer key with detailed rubrics for grading
Key Concepts Covered
➡️ Data analysis – Understanding how to organize and interpret data for scientific conclusions
➡️ Graph types – Differentiating between line graphs, bar charts, and other visual tools
➡️ Data trends – Identifying patterns, outliers, and understanding their significance
➡️ Statistics in science – Calculating median, mean, and understanding their use in data summaries
➡️ Data presentation – Choosing the correct graph to accurately display data for clear communication
Question Types / Formats
1. Reading passage analysis — comprehension-based questions
2. True or false questions — quick assessments of key concepts
3. Multiple-choice questions — selecting the best data representation or interpretation
4. Fill in the blank — reinforcing technical vocabulary
5. Brief responses — encouraging explanation and critical thinking skills
Teacher Benefits
✅ Provides a comprehensive yet easy-to-use assessment aligned with TEKS standards
✅ Facilitates formative and summative evaluation of students' understanding of data representation
✅ PDF format allows for quick printing and distribution in any classroom setting
✅ Supports differentiated instruction by offering various question types
✅ Includes detailed answer rubrics for straightforward grading and feedback
Student Benefits
✅ Enhances understanding of how data can be visually represented and interpreted
✅ Builds critical thinking through analysis and explanation questions
✅ Promotes mastery of graphing concepts and statistical methods
✅ Develops skills in data organization, analysis, and communication
✅ Prepares students for higher-level science and math assessments
Perfect For
➡️ Classroom instruction to introduce or review data representation topics
✅ Homework assignments that reinforce recent lessons
➡️ Assessment tools to measure student mastery of data analysis skills
✅ Substitute teacher resources for quick, effective evaluation
➡️ Practice activities to boost confidence before state testing
✅ STEM or science project support for accurate data presentation and analysis
Ready to enhance your Science teaching? Download this dynamic worksheet today and inspire your students to analyze and visualize data confidently! 🚀