Grade 7 Science – Graphical Representation Worksheet (PDF) – Ontario Standards
Description
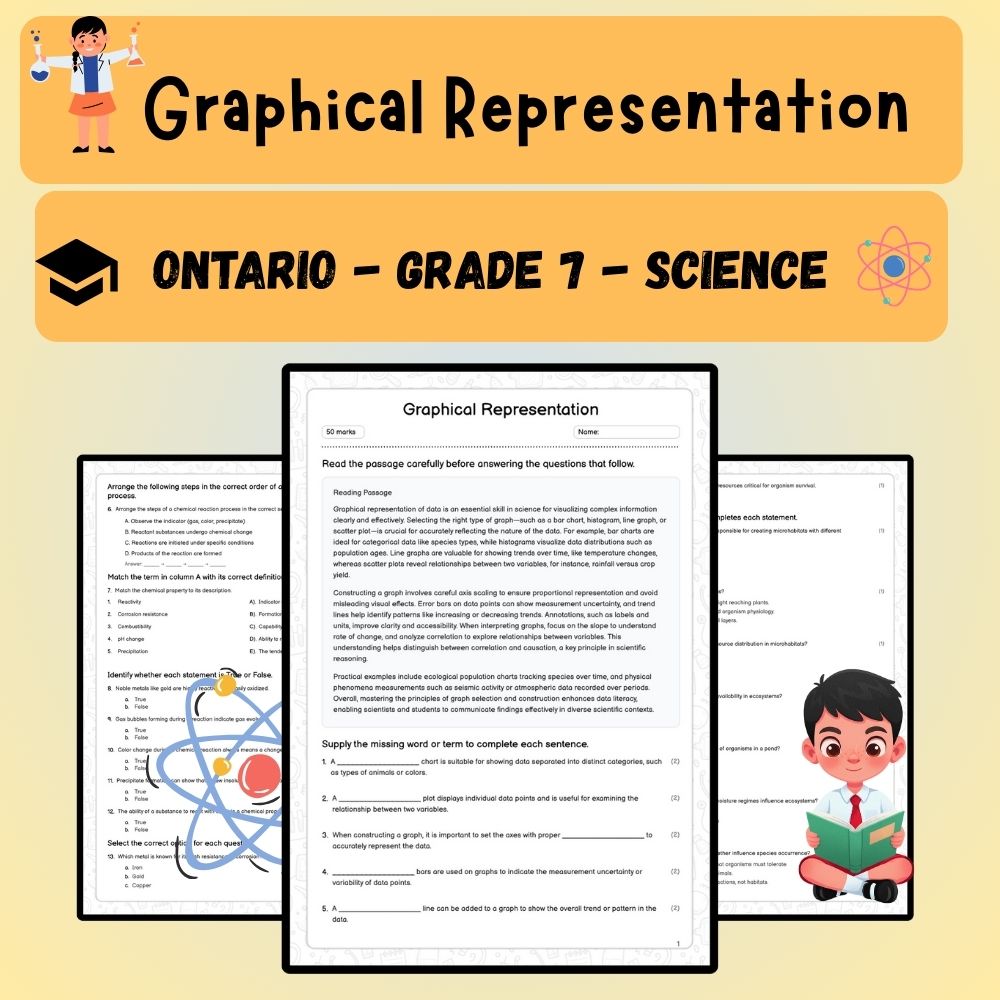
Struggling to help your Grade 7 students master the art of data visualization? 🎯 This engaging and comprehensive worksheet focuses on graphical representation in science, aligned with Ontario standards. Designed to build students' skills in creating, analyzing, and interpreting various types of scientific graphs, this resource is perfect for reinforcing key concepts essential for scientific literacy.
What's Included
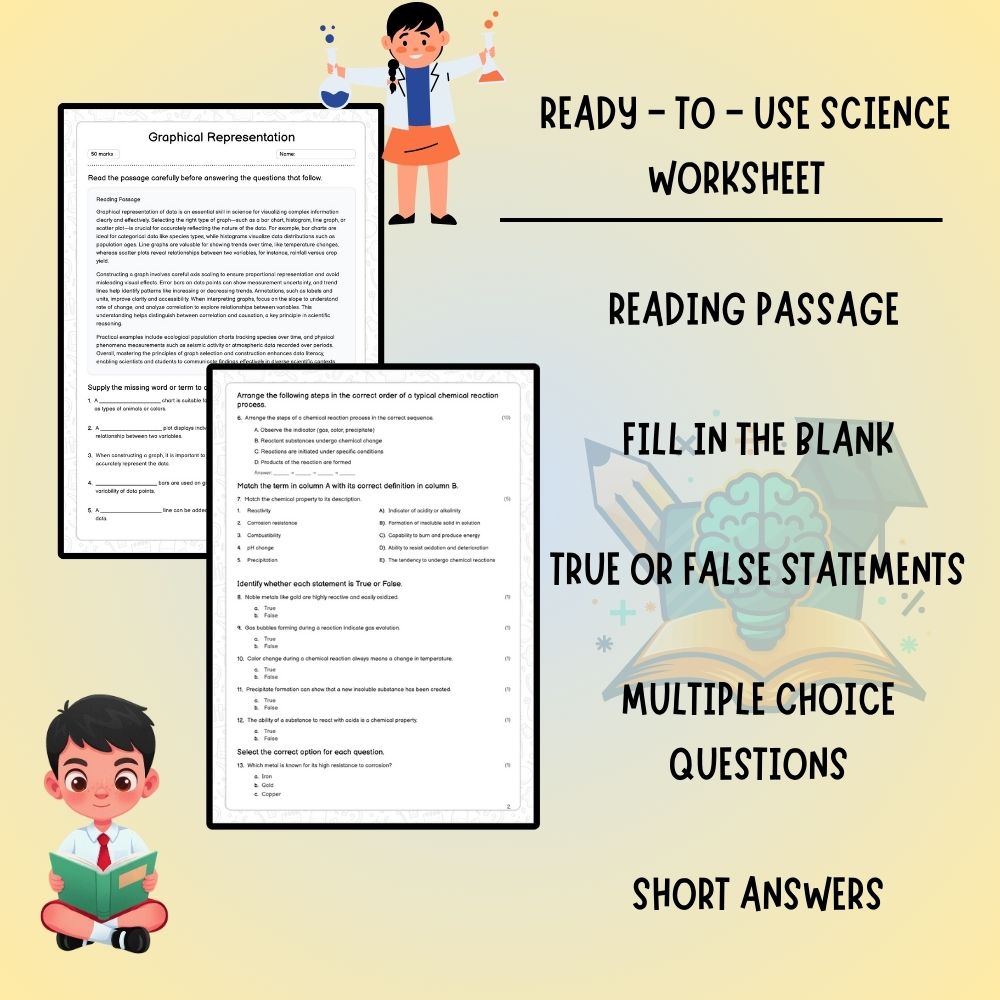
✅ In-depth reading passage explaining the importance of graphical data representation
✅ Six fill-in-the-blank questions to practice identifying different chart types
✅ An activity on sequencing steps involved in creating graphs
✅ Matching exercises to connect graph types with their descriptions
✅ True/False questions to clarify common misconceptions about graphs
✅ Ten multiple-choice questions assessing understanding of graph functions and uses
✅ Short answer prompts encouraging critical thinking about data presentation
✅ An essay question exploring principles of effective graphical communication
Key Concepts Covered
➡️ Data visualization in science – Understanding how graphs help interpret complex data
➡️ Types of graphs – bar charts, histograms, scatter plots, line graphs, and pie charts
➡️ Choosing the right graph – matching data types with appropriate visual formats
➡️ Graph construction – steps from data collection to final presentation
Question Types / Formats
1. Reading passage comprehension to introduce concepts
2. Fill-in-the-blank to identify graph types
3. Ordering steps in process activities
4. Matching exercises for graph descriptions
5. True/False for misconceptions
6. Multiple-choice questions for practical understanding
7. Short answer prompts for in-depth explanation
8. Essay questions for critical analysis
Teacher Benefits
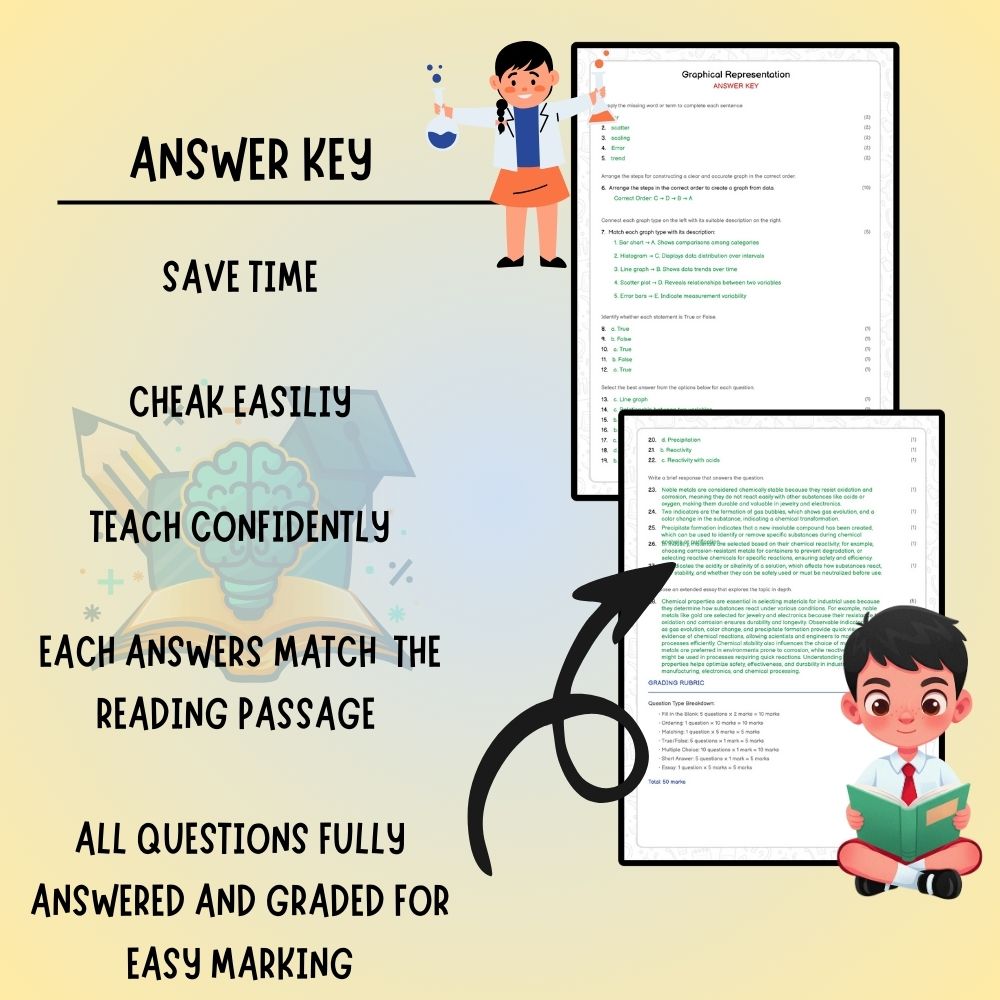
✅ Save preparation time with ready-to-use engaging activities aligned with Ontario standards
✅ Provide differentiated learning with varied question formats
✅ Track student progress on graph interpretation skills effectively
Student Benefits
✅ Develop visual literacy essential for science literacy
✅ Build confidence in creating and analyzing different types of graphs
✅ Strengthen understanding of data presentation, interpretation, and communication
Perfect For
➡️ Science classrooms teaching data visualization and graph skills
➡️ Assessment preparation aligned with Ontario curriculum standards
➡️ Independent study or homework activities to reinforce learning
Transform your data lessons today! Download this resource now and empower your students to become confident interpreters of scientific information! 🚀