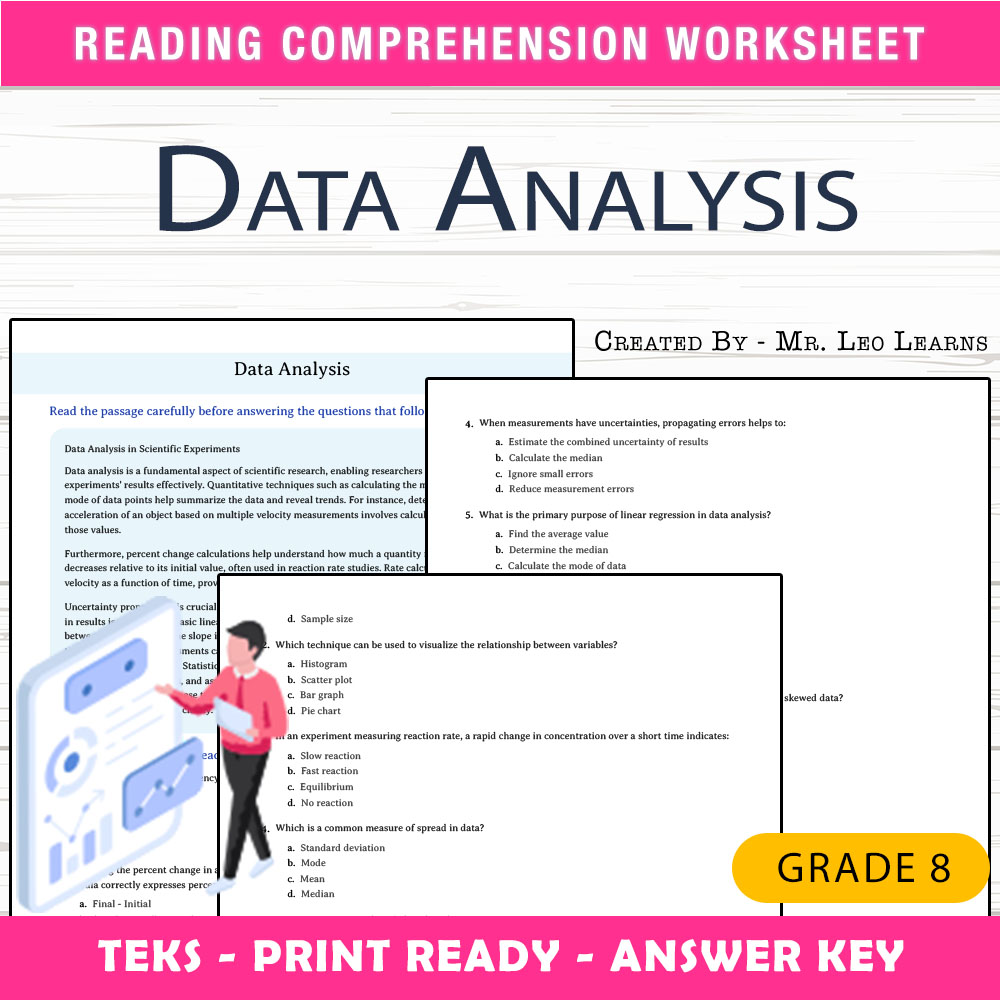
Grade 8 Science — Data Analysis Worksheet for Mastering Scientific Data
Description
Imagine standing at the front of your classroom, watching students grapple with interpreting biological data, analyzing experiments, or understanding the significance of various statistical measures in scientific research. Some students may feel overwhelmed trying to differentiate between measures like mean, median, and mode, or struggle to interpret charts and graphs accurately. This worksheet provides a straightforward, print-and-go resource that simplifies complex concepts related to data analysis, making it easier for students to develop confidence and independence in handling scientific data.
What This Resource Helps Students Do
This worksheet is designed to support eighth-grade students in developing key skills in analyzing and interpreting scientific data. It guides students through a reading passage that introduces core concepts of data analysis within a scientific context, followed by multiple-choice questions that reinforce understanding of measures of central tendency, data interpretation, and percent change calculations. The structured format encourages step-by-step reasoning, allowing students to build their analytical skills at their own pace. As students work through these exercises, they reinforce their ability to read and understand scientific information, identify appropriate statistical measures, and apply them accurately to real-world data scenarios. Whether used as independent practice or small-group review, this worksheet helps solidify foundational data analysis skills crucial for success in science.
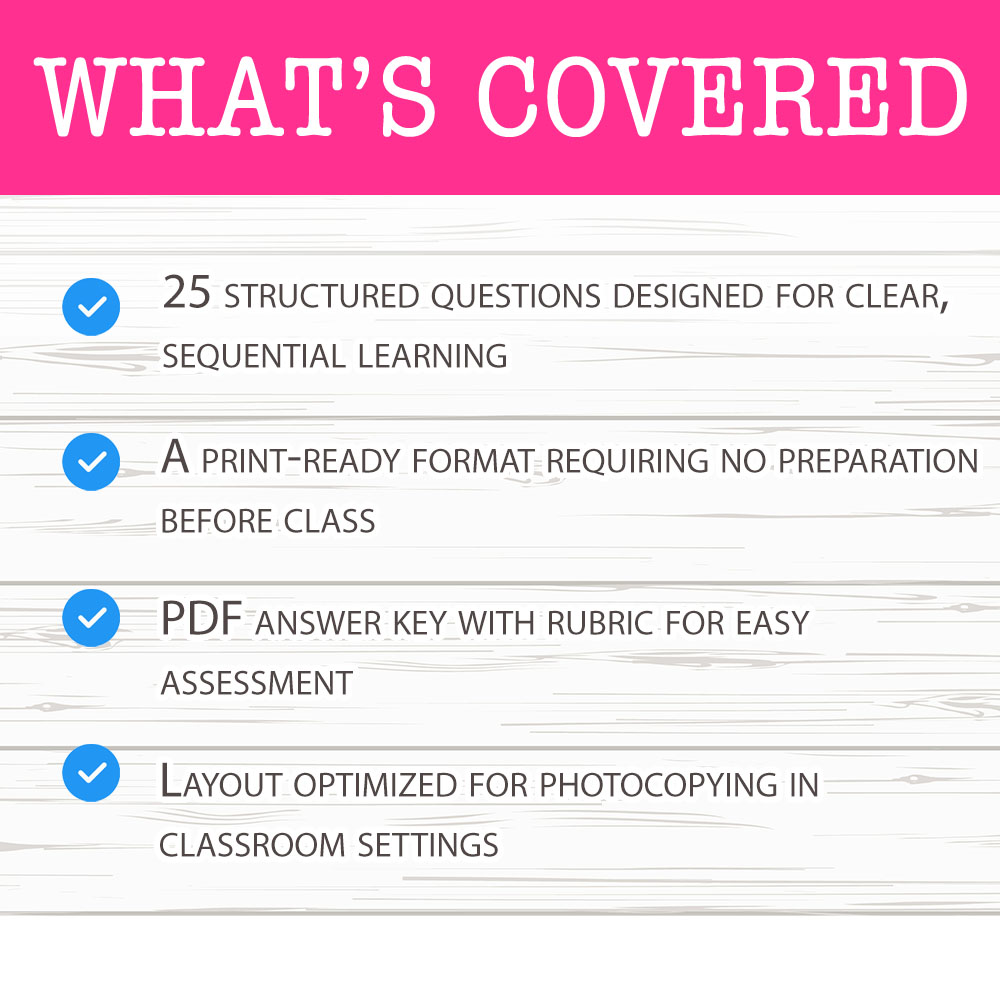
Inside the PDF• 25 structured questions designed for clear, sequential learning
• A print-ready format requiring no preparation before class
• PDF answer key with rubric for easy assessment
• Layout optimized for photocopying in classroom settings
This worksheet enhances student learning by providing focused practice on interpreting scientific data, which is vital for understanding experimental results and drawing accurate conclusions. The reading passage sets a context that encourages students to connect theory with real-world applications, fostering deeper engagement. The multiple-choice questions challenge students to apply their understanding of measures of central tendency and percent change, strengthening their quantitative reasoning skills. The step-by-step approach guides students from initial comprehension to more complex analysis, helping them build confidence and avoid common misconceptions. As students work through these questions, they develop critical thinking and problem-solving abilities that support mastery of data interpretation in science.
Core Skills Students Will Develop- ➡️ Reading comprehension of scientific texts
- ➡️ Understanding and calculating measures of central tendency
- ➡️ Analyzing data and interpreting graphs or charts
- ➡️ Applying formulas to compute percent change
- ➡️ Critical thinking about scientific information
This worksheet is a versatile resource that can be used for classwork, homework assignments, or early finisher activities. It supports review sessions after lessons on data analysis or serves as a formative assessment to gauge student understanding. Teachers often incorporate it into small-group practice, providing targeted support to students who need extra reinforcement. Its clear, print-ready format makes it easy to distribute during lessons or for part of a quick skills check during tutoring or remediation sessions. The worksheet’s structure encourages independent work, helping students develop confidence in analyzing scientific data on their own.
Why This PDF Saves TimeThis resource offers a reliable and efficient solution for busy teachers. The print-and-go format means no additional prep is required—simply print the worksheet and your answer key for immediate use. Its organized layout ensures consistency across different classes and periods, providing a standard tool for data interpretation practice. The answer key with rubric allows quick assessment, saving valuable time during grading or feedback. Using this worksheet helps maintain lesson flow while ensuring students receive meaningful practice with minimal classroom disruption.
Remember, this worksheet is ready to print and can be seamlessly integrated into your science instruction to support student mastery of data analysis skills. Its clear design and focused content make it a trustworthy resource for enhancing student understanding and confidence in scientific data interpretation. 📚