Grade 8 Science – Data Representation Worksheet for Mastery
Description
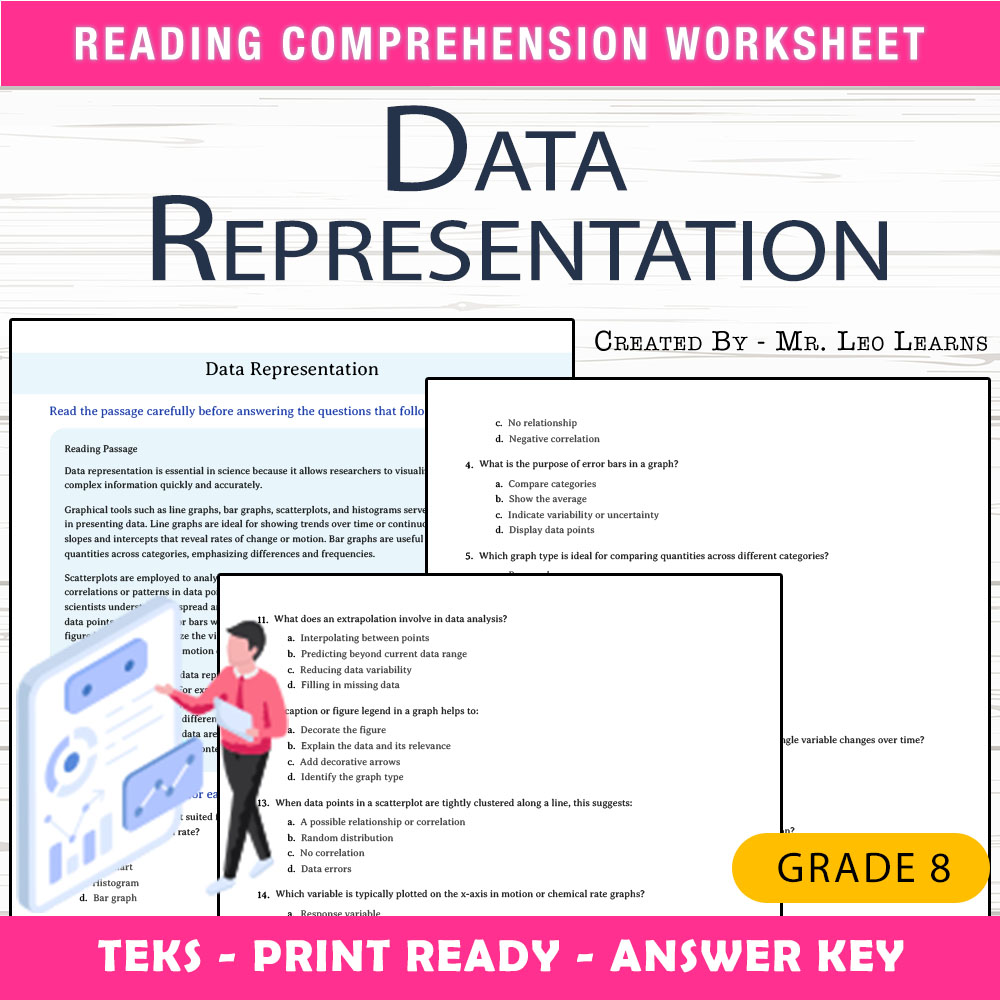
Stepping into the classroom, you might notice students feeling overwhelmed when asked to interpret and present scientific data. They often struggle to differentiate between types of graphs or understand how data visualization can clarify complex findings. This worksheet provides a straightforward, print-and-go solution designed to guide students through the essential skills of data representation in science. It helps them build confidence in reading, creating, and analyzing various data displays, making the abstract more concrete and accessible.
What This Resource Helps Students Do
This worksheet supports students in developing a thorough understanding of different data representation methods used in science. It guides them through analyzing a reading passage that underscores the importance of data visualization, followed by multiple choice questions that reinforce their grasp of graph types and their purposes. Students will practice identifying suitable graph formats for specific data sets, interpreting histogram bars, and understanding the significance of data trends. These activities promote independent thinking and reinforce skills in interpreting graphical data, critical in scientific inquiry and communication.
Inside the PDF
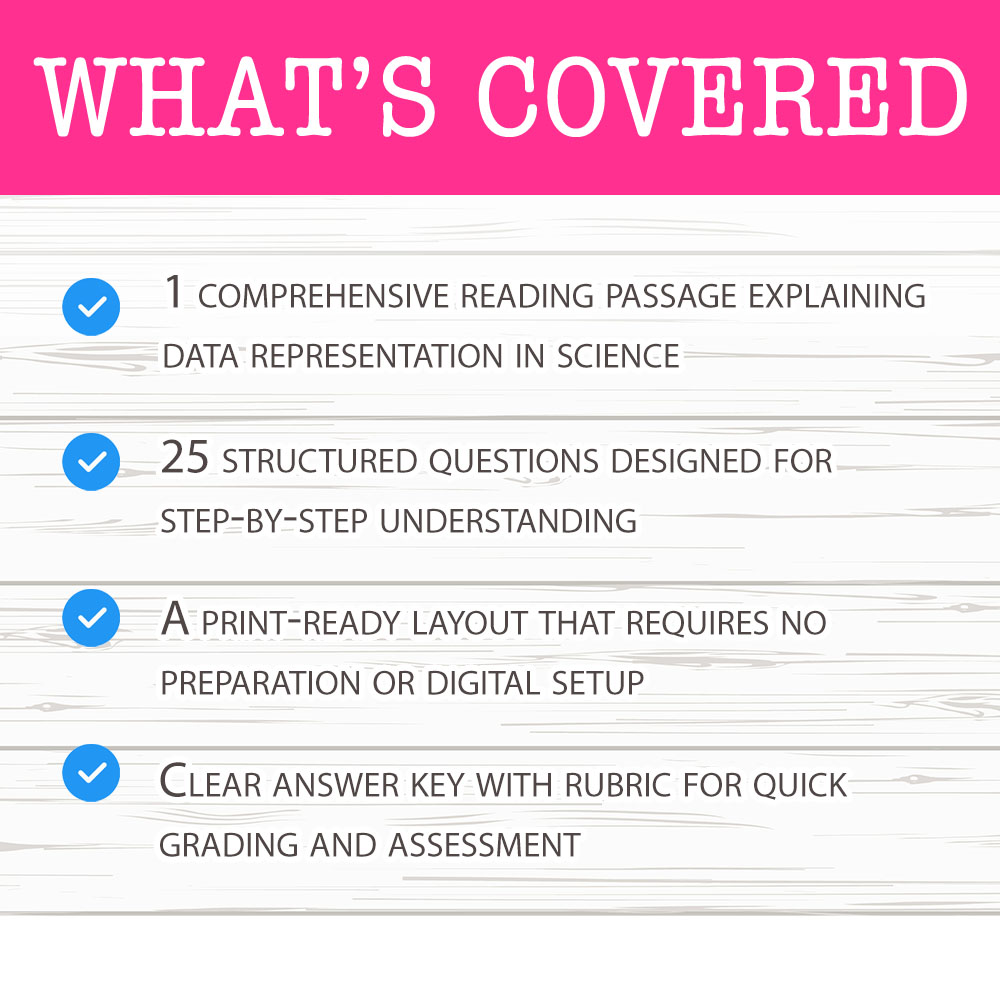
• 1 comprehensive reading passage explaining data representation in science
• 25 structured questions designed for step-by-step understanding
• A print-ready layout that requires no preparation or digital setup
• Clear answer key with rubric for quick grading and assessment
• Designed to be photocopied easily for classroom use
How It Improves Learning
This worksheet encourages clarity by breaking down complex concepts into manageable parts, helping students grasp why different types of graphs are used in science. The reading passage offers context that connects theory with real-world applications, fostering understanding. The multiple choice questions challenge students to differentiate between graph types and interpret data correctly, building their confidence. By working through these questions, students refine their reasoning skills and develop a solid foundation in data visualization. The answer key with rubric supports teachers in providing immediate feedback, reinforcing learning and promoting mastery.
Core Skills Students Will Develop
- ➡️ Understanding various types of data representation in science
- ➡️ Interpreting histograms, bar graphs, and other charts
- ➡️ Applying knowledge to choose appropriate graph types for data sets
- ➡️ Analyzing data trends and making scientific inferences
Ways Teachers Use This Worksheet
This worksheet can be used during class lessons to introduce or reinforce concepts related to data visualization. It also works well as a homework assignment or review activity to assess student understanding after instruction. Teachers might utilize it during small-group stations for targeted practice or as an early finisher task. Additionally, it serves as an effective assessment tool to gauge student mastery of key data representation skills in science, ensuring foundational knowledge is solid before progressing to more complex concepts.
Why This PDF Saves Time
Because this resource is formatted in a print-ready PDF, teachers can simply print copies and distribute them without any additional setup. The structured design minimizes prep work and delivers a consistent, reliable tool for classroom instruction. With an included answer key featuring rubrics, grading becomes straightforward and efficient. This saves valuable time while maintaining an organized approach to teaching data representation skills in science.
As you prepare your lessons on data visualization, remember that this worksheet is ready to print, classroom-friendly, and designed to guide students toward greater understanding and confidence in interpreting scientific data. It’s a practical addition to your teaching toolkit that helps your students succeed with clarity! 😊