

Grade 8 Science | Data Representation Worksheet (PDF+ Answer Key)
Description
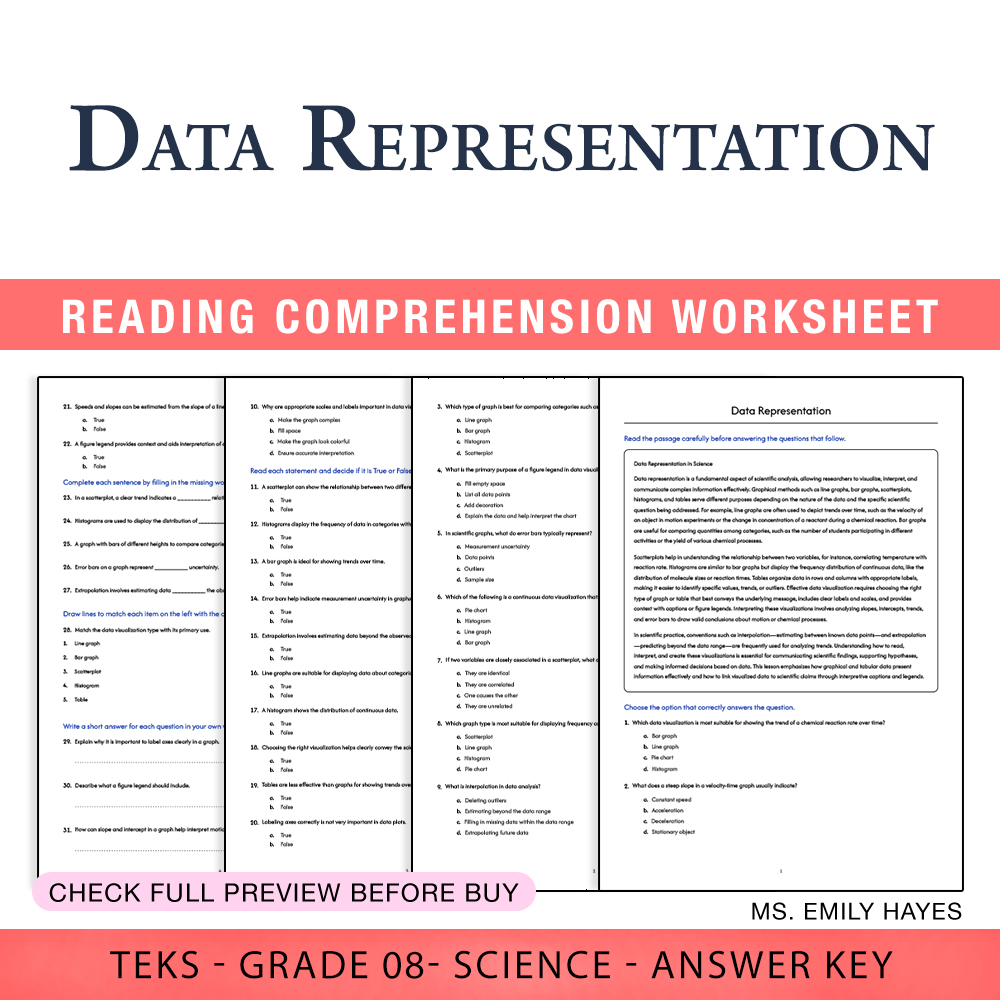
Are you seeking an efficient way to strengthen your Grade 8 students' ability to interpret and communicate scientific data? This Data Representation worksheet is designed to meet the challenge head-on, providing print-ready, classroom-essential materials that help students master the crucial skill of visualizing and analyzing data in science. With data visualization being an integral part of scientific literacy, this resource targets the development of meaningful comprehension of graphs, charts, and tables—key tools used to interpret real-world scientific phenomena.
Why Teachers Love This
✅ Saves precious preparation time with ready-to-print, high-quality PDF worksheet and answer key
✅ Suitable for immediate classroom use—no complex setup, print-and-go format
✅ Enhances students' understanding of data visualization through engaging questions and activities
✅ Fully aligned with TEKS standards, focusing on essential graphing and data analysis skills
Why Students Succeed With This
✅ Clear, step-by-step instructions help students develop confidence in reading and creating various data visualizations
✅ Varied question types—including multiple choice, true/false, fill-in-the-blanks, matching, and essay—cater to different learning styles
✅ Activities connect scientific concepts with real-world data, fostering deeper engagement and understanding
✅ Designed to build skills in interpreting graphs, understanding relationships, and communicating scientific information effectively
What You Get
Complete, print-ready PDF worksheet and answer key including:
• Sections covering a range of question types, from reading comprehension and multiple choice to short answers and essays
• Exercises focused on data visualization types such as graphs, histograms, scatterplots, and trend analysis
• A comprehensive rubric for assessing student responses
• Designed to fit seamlessly into your lesson plans or review sessions
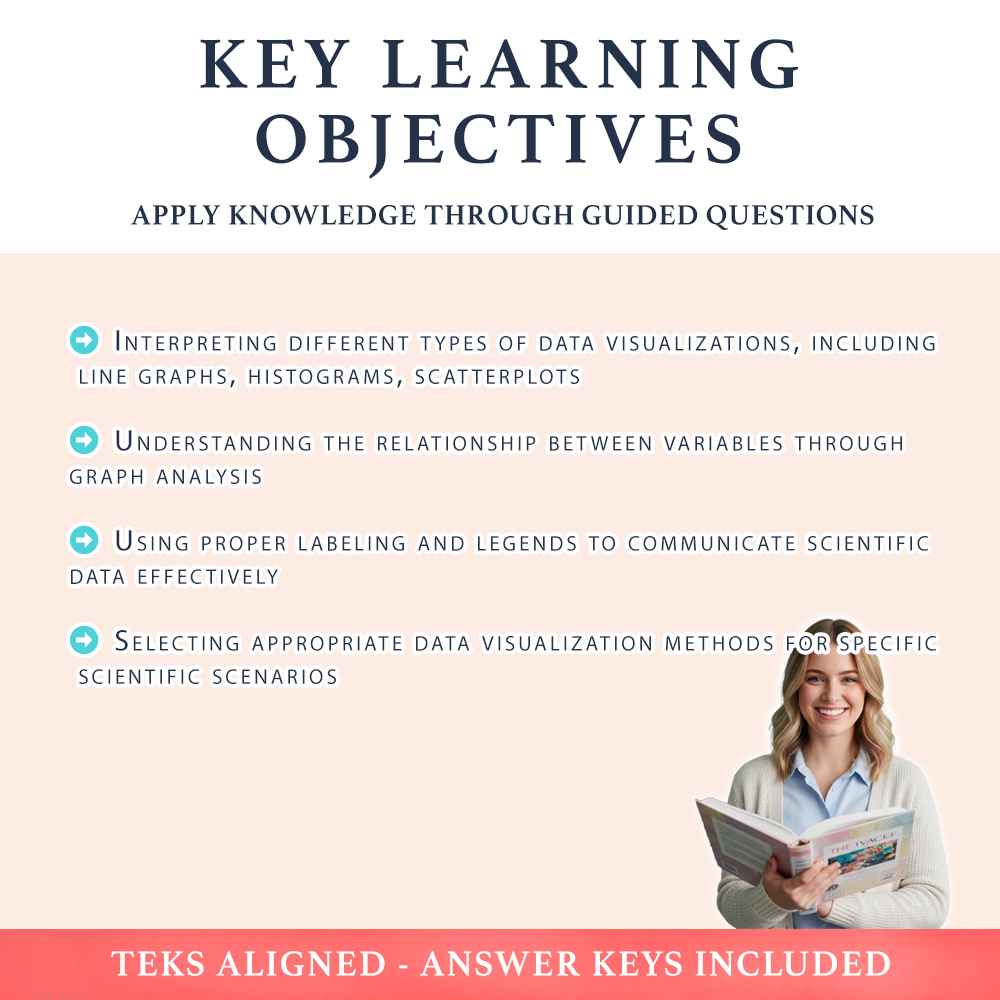
Key Learning Objectives
Students will develop essential skills in:
➡️ Interpreting different types of data visualizations, including line graphs, histograms, scatterplots
➡️ Understanding the relationship between variables through graph analysis
➡️ Using proper labeling and legends to communicate scientific data effectively
➡️ Selecting appropriate data visualization methods for specific scientific scenarios
Ideal Usage
This worksheet is perfect for in-class exercises, homework assignments, or review activities focused on data analysis and representation. Its print-ready format supports whole-class instruction, small-group work, or independent practice. Utilize it to reinforce students’ skills in interpreting research data, preparing visual displays, and justifying their data choices in scientific contexts.
Boost your students’ understanding of data representation, equip them with critical scientific communication skills, and foster confidence in analyzing real-world data trends 📊. This resource ensures your students are prepared to excel in scientific inquiry and reporting, aligned with Grade 8 standards, and ready to present data clearly and convincingly.