
Grade 8 Science | Data Representation Worksheet | TEKS Aligned
Description
Are your Grade 8 students exploring the fundamentals of data representation in science?
🌿 This worksheet, aligned with TEKS standards, is designed to enhance understanding of how scientists visualize and interpret data through various graph types and representations. It provides a comprehensive, student-friendly approach to mastering essential concepts in scientific data analysis, all presented in a clear PDF format for easy use in your classroom.
What’s Included
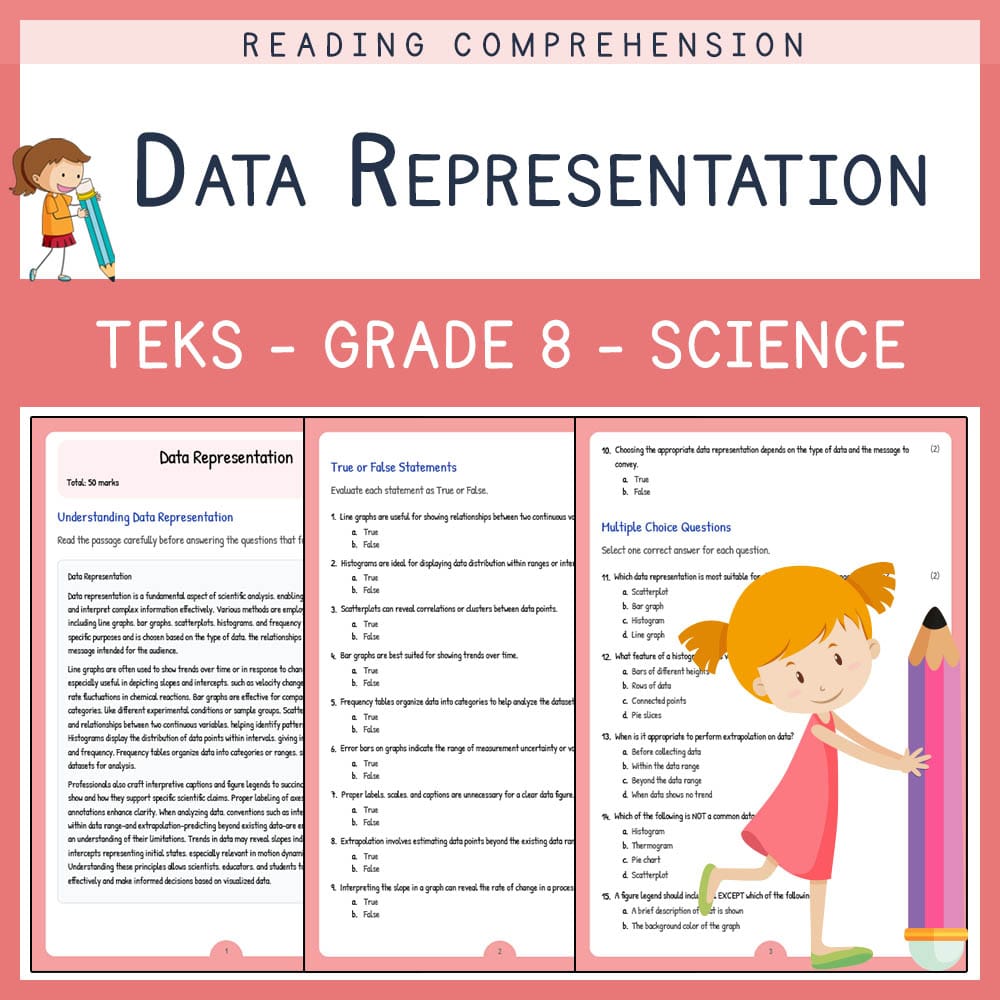
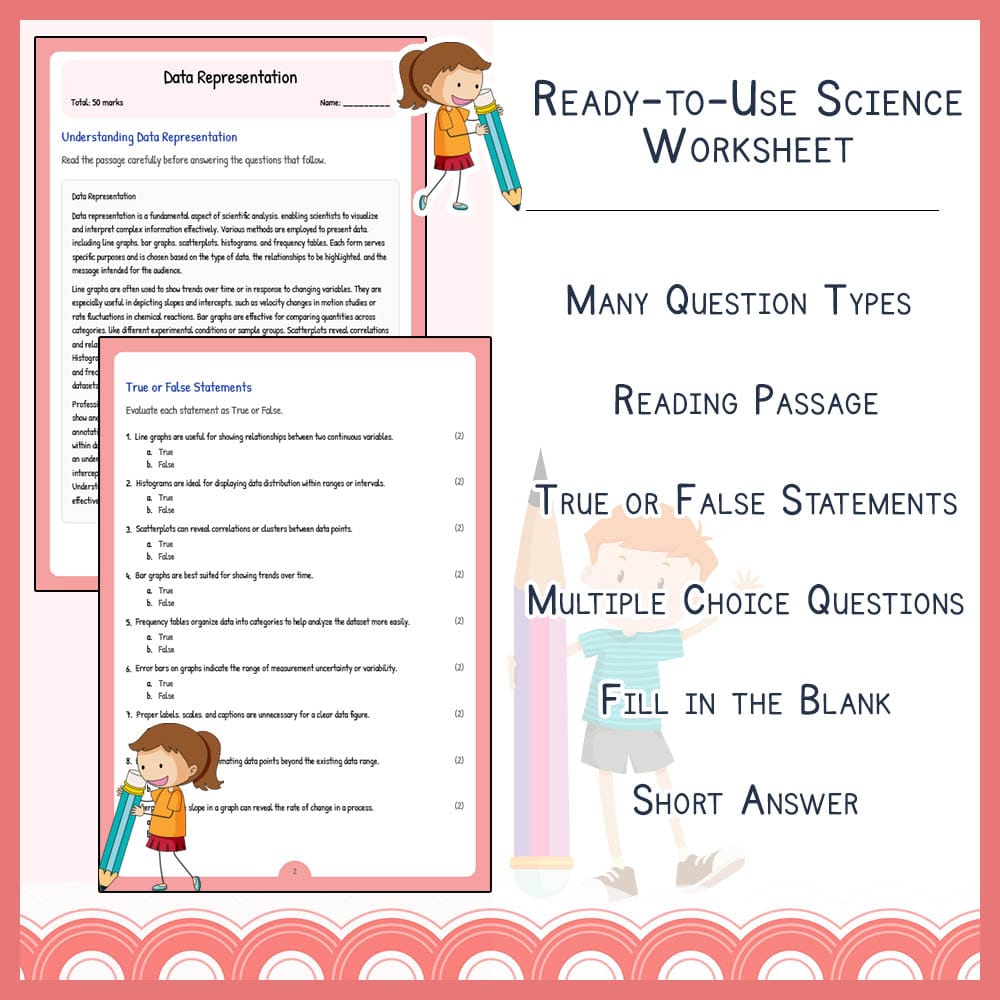
✅ A reading passage on understanding data representation, outlining key concepts and significance in science
✅ 10 true or false statements to assess foundational knowledge
✅ 5 multiple choice questions focusing on data visualization methods
✅ 5 fill-in-the-blank questions for key terminology mastery
✅ 5 short answer questions to promote critical thinking and application
✅ PDF worksheet and PDF answer key with rubric for easy grading
✅ Designed exclusively in PDF format for convenient printing and distribution
Key Concepts Covered
➡️ Data visualization – Understanding how visual tools help interpret scientific data
➡️ Types of graphs – Line graphs, histograms, bar charts, and their appropriate uses
➡️ Interpreting trends – Recognizing increasing, decreasing, and variable trends in data
➡️ Error bars and data variability – Representing uncertainty and variability in datasets
➡️ Effective data communication – Using figures, legends, and captions for clarity
Question Types / Formats
1. Reading passage to introduce core concepts and context
2. True or false statements to quickly assess comprehension
3. Multiple choice questions evaluating knowledge of data visualization tools
4. Fill-in-the-blank statements to reinforce vocabulary and concepts
5. Short answer prompts encouraging explanation and critical thinking
Teacher Benefits
✅ Streamlines lesson planning with ready-to-use content aligned with TEKS standards
✅ Provides multiple question formats for diversified assessment approaches
✅ PDF format ensures easy printing, copying, and distribution without technical issues
✅ Supports diverse learning styles through varied question types
✅ Includes an answer key with rubric to facilitate efficient grading
Student Benefits
✅ Reinforces understanding of key concepts in data representation
✅ Develops critical thinking skills through analysis and explanation questions
✅ Enhances ability to interpret different types of scientific graphs
✅ Promotes vocabulary mastery related to data visualization
✅ Prepares students for real-world scientific communication and data analysis
Perfect For
➡️ Classroom instruction, providing a comprehensive assessment tool
✅ Homework assignments to reinforce daily lessons
➡️ Independent or group practice sessions to build confidence in data skills
✅ Pre-lesson assessments to gauge prior knowledge
➡️ Exit tickets or formative checks during units on data analysis
Ready to enhance your Science teaching? Download this dynamic worksheet today and inspire your students to excel in understanding data representation! 🚀