Grade 8 Science — Graphical Reasoning Worksheet for Visual Data Analysis
Description
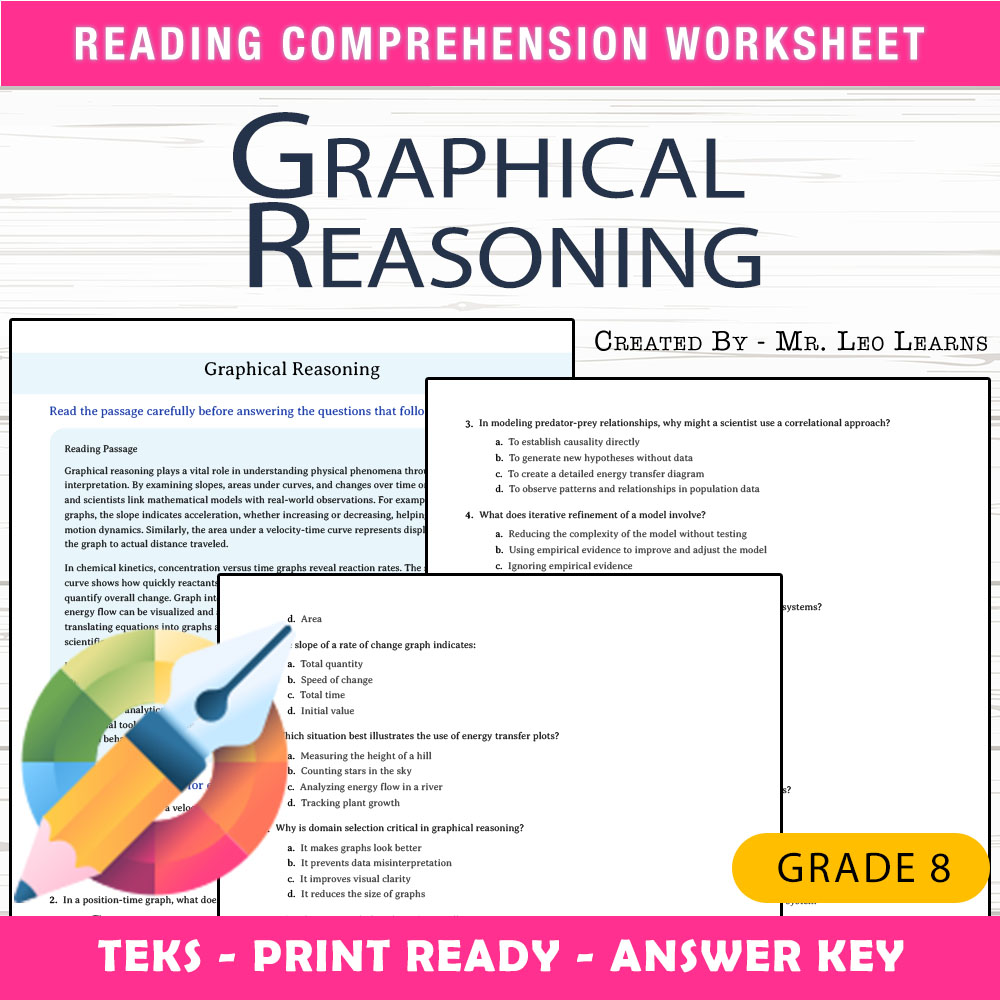
Imagine a classroom where students are engaged in analyzing visual data but struggle to interpret the meaning behind graphs and charts. As they work through complex information, it can sometimes feel overwhelming to connect the dots between the visual representations and the underlying phenomena. This Grade 8 Science worksheet on Graphical Reasoning offers a clear, structured approach to mastering this essential skill, providing students with practice in interpreting velocity-time and position-time graphs. Designed to be print-and-go, it helps teachers reinforce concepts efficiently while supporting students’ confidence in understanding physical data through visual means.
What This Resource Helps Students Do
This worksheet guides students in developing their ability to analyze and interpret various types of graphs related to motion and physical phenomena. It encourages independent thinking by providing a combination of reading passages and multiple-choice questions that focus on real-world applications of graphical data. Students will learn to identify what different features of a graph represent, such as slope and area, and understand how these relate to concepts like velocity, position, and acceleration. The questions are structured to build reasoning skills step-by-step, helping students connect abstract graph features with physical interpretations, thus strengthening their understanding of motion in a visual context.
Inside the PDF• 1 reading passage that introduces the importance of graphical reasoning in physics
• 25 multiple-choice questions focused on analyzing velocity and position graphs
• A print-ready format, perfect for immediate classroom use without preparation
• A comprehensive answer key with a rubric to facilitate quick assessment
• Designed for easy photocopying, making it simple to distribute to students during lessons or assessments
This worksheet is designed to elevate students’ understanding of how graphs visually communicate physical concepts. By starting with a reading passage that explains key ideas, students can relate visual data to real-world phenomena. The multiple-choice questions challenge their reasoning, pushing them from recognizing basic features to understanding what those features reveal about motion. The structured questions help students become more confident in using visual data to draw conclusions, improving their analytical skills. As students work through the worksheet, they develop clarity in interpreting graphs, which strengthens their overall grasp of physics concepts and supports their ability to analyze data independently. The combined focus on comprehension and reasoning advances their critical thinking and scientific literacy.
Core Skills Students Will Develop- ➡️ Interpreting velocity-time graphs
- ➡️ Understanding the significance of the slope in graphs
- ➡️ Analyzing area under the curve in position-time graphs
- ➡️ Applying visual data analysis to physics concepts
- ➡️ Developing reasoning and critical thinking skills
This Graphical Reasoning worksheet can be used in a variety of ways to support student learning. It works well as part of a lesson on motion and graphs, as a formative assessment during instruction, or as homework to reinforce understanding. Teachers may also use it for small-group practice, providing targeted support to students who need additional help interpreting graphs. Additionally, it serves as a quick evaluation of students' grasp of graph features, making it easier to identify areas that may require further instruction or review. Overall, this resource provides a practical and flexible tool to enhance classroom instruction and student comprehension.
Why This PDF Saves TimeThis worksheet simplifies lesson planning by providing a ready-made, print-and-go resource that requires no additional preparation. Its clear layout and comprehensive questions ensure consistency during assessment or practice sessions. The included answer key with rubric allows teachers to quickly evaluate student responses without spending extra time grading or creating supplementary materials. As a reliable and immediate resource, it helps teachers maximize instructional time while maintaining high-quality practice opportunities for students.
With this worksheet, teachers are equipped with a straightforward, classroom-friendly tool that supports deepening students’ understanding of graphical data and motion concepts. It’s ready to be printed and used confidently, helping students develop vital analytical skills while making classroom instruction more efficient and engaging. 😊