Grade 8 Science | Graphical Reasoning Worksheet | TEKS Aligned
Description
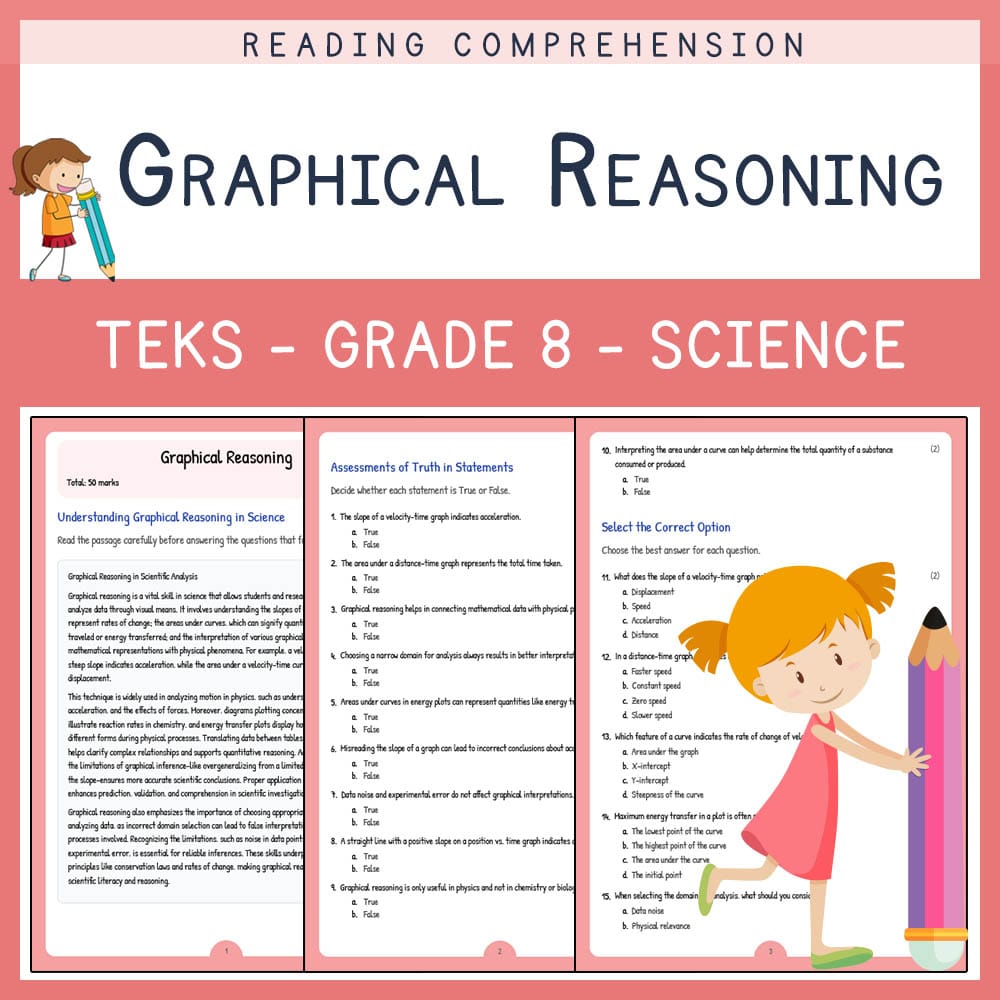
Are your Grade 8 students exploring the essential skills of graphical reasoning in science?
🌿 This Worksheet Elena is designed to build understanding of interpreting and analyzing graphs, aligned with TEKS standards for middle school science. Designed specifically for Grade 8, this PDF worksheet set offers comprehensive practice to enhance students' ability to interpret data visually, an essential skill for success in physics and general science concepts.
What's Included
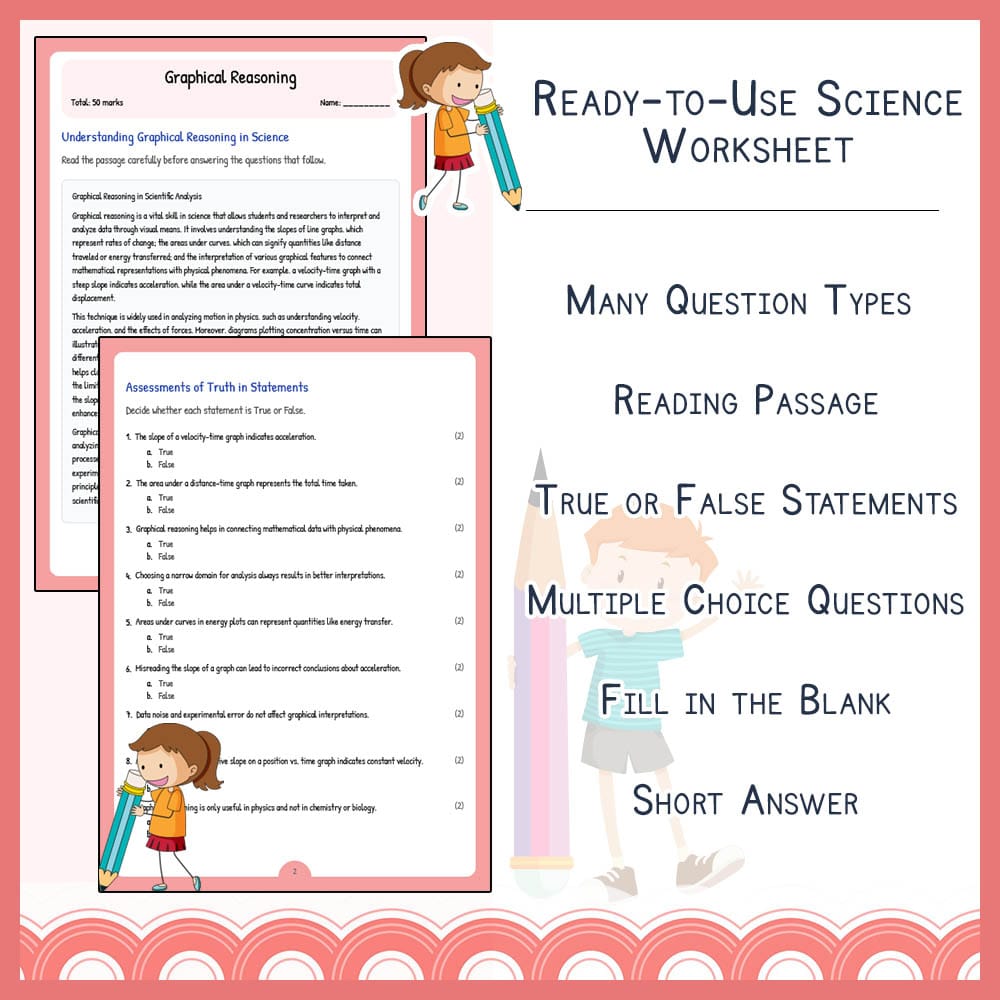
✅ Complete PDF worksheet with five engaging sections covering different question types
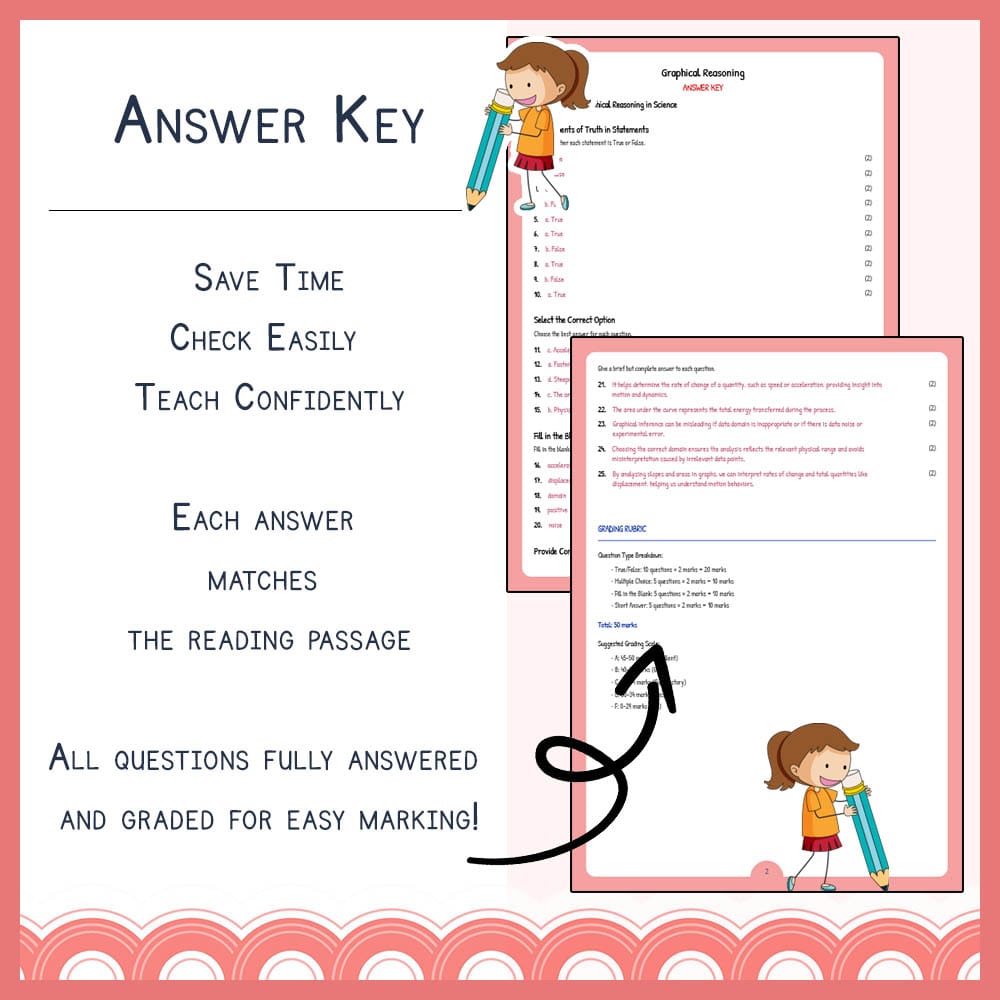
✅ PDF answer key with detailed rubric for quick grading
✅ Total of 25 questions, including reading comprehension, true/false, multiple choice, fill-in-the-blank, and short answer sections
✅ Clear instructions and space for student responses, optimized for classroom or independent review
✅ Designed for print and easy distribution in any classroom setting
Key Concepts Covered
➡️ Graph interpretation – Understanding how to read and interpret various types of scientific graphs
➡️ Slope analysis – Recognizing what the slope indicates in terms of velocity, acceleration, or other physical quantities
➡️ Area under curves – Calculating and understanding how the area relates to physical concepts like distance or energy
➡️ Graph-based reasoning skills – Developing critical thinking through analysis of graphical data
➡️ TEKS alignment – Ensuring students meet state standards for science understanding and data analysis skills
Question Types / Formats
1. Reading passage with comprehension questions
2. True/False statements to assess factual understanding
3. Multiple choice questions to evaluate conceptual knowledge
4. Fill-in-the-blank prompts to reinforce key terms and concepts
5. Short answer questions to develop analytical writing skills
Teacher Benefits
✅ Provides a comprehensive, ready-to-use assessment tool that is perfect for classroom instruction or homework
✅ Supports TEKS standards compliance, ensuring standards-based education
✅ Facilitates quick grading with an answer key and rubric included
✅ Printable PDF format allows for easy distribution and flexible use
✅ Enhances student understanding of graphical reasoning vital for physics and science data analysis
Student Benefits
✅ Strengthens ability to interpret and analyze scientific graphs confidently
✅ Builds essential skills in understanding the relationship between graph slopes and physical quantities
✅ Develops critical thinking through reasoning about data patterns and relationships
✅ Improves ability to apply graphical reasoning in real-world science contexts
✅ Prepares students for more advanced physics and science coursework involving data analysis
Perfect For
➡️ Classroom instruction focused on data analysis and physics concepts
✅ Homework assignments to reinforce classroom lessons
➡️ Science labs involving graph interpretation
✅ Practice for standardized tests covering graph analysis and science reasoning
➡️ Differentiated instruction activities for all learning levels
Ready to enhance your Science teaching? Download this dynamic worksheet today and inspire your students to master graphical reasoning! 🚀