Grade 9 Science — Worksheet MCQ Paper for Mastering Graphical Literacy
Description
Imagine standing at the front of your classroom, observing your students engrossed in analyzing a complex data set. Some are scratching their heads, trying to interpret the scatterplot, while others struggle to understand the histogram's implications. As a teacher, you want to provide clear, straightforward tools that help students build confidence in understanding graphical representations. This Grade 9 Science worksheet focuses on mastering graphical literacy, an essential skill for analyzing data effectively. It offers a simple way to guide students through the visual interpretation of data, reinforcing key concepts in a structured and accessible format.
What This Resource Helps Students Do
This worksheet helps students develop their ability to read, interpret, and analyze different types of graphs and charts used in science. It walks them through understanding the purpose of each graphical representation, improves their skills in extracting meaningful insights from data visuals, and enhances their ability to connect visual information with scientific concepts. The combination of reading passages and multiple-choice questions encourages independent thinking and reflection, providing practice in reasoning about data displays. Students learn to identify the primary use of scatterplots, evaluate the influence of histogram features, and understand the role of various graph elements in conveying data stories. Overall, it builds their confidence in scientific data analysis and prepares them to interpret graphs accurately in real-world contexts.
Inside the PDF
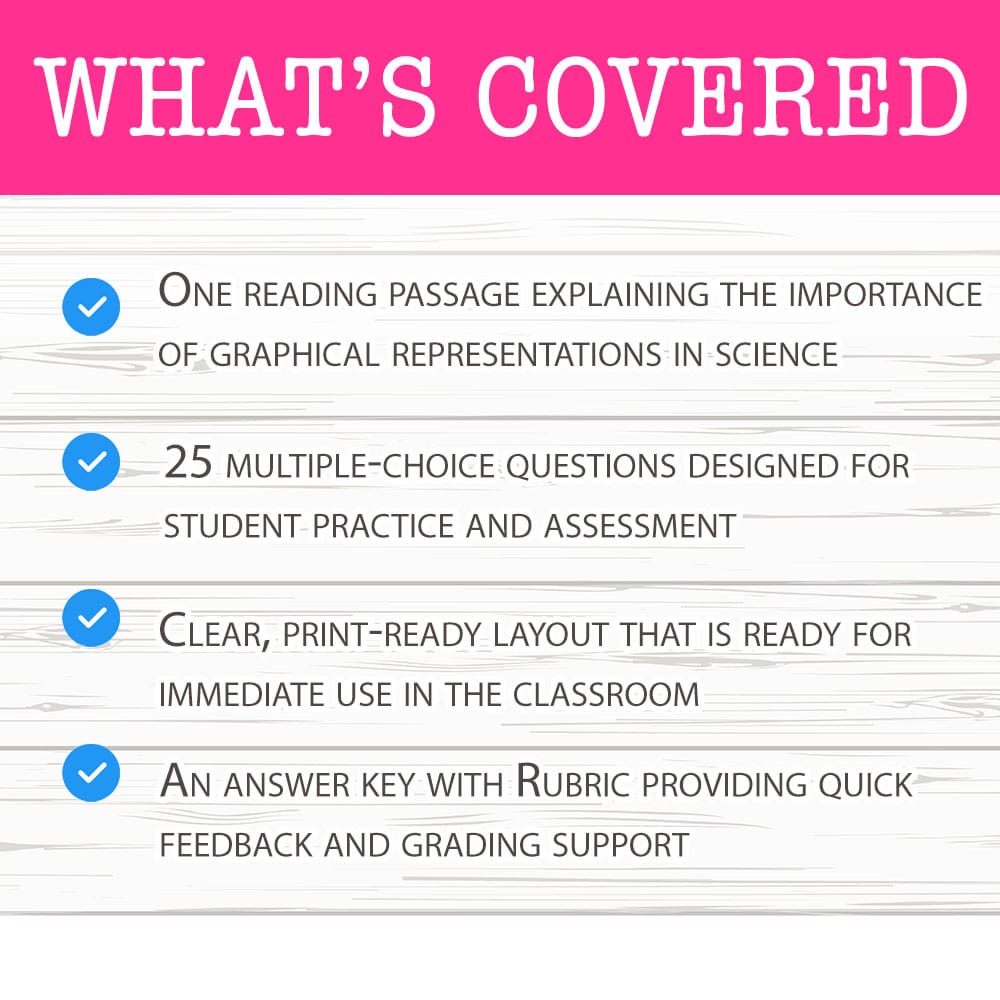
• One reading passage explaining the importance of graphical representations in science
• 25 multiple-choice questions designed for student practice and assessment
• Clear, print-ready layout that is ready for immediate use in the classroom
• An answer key with Rubric providing quick feedback and grading support
• Designed for ease of photocopying and seamless integration into lessons
This worksheet enhances student understanding by providing structured, focused practice with visual data. The reading passage introduces the core concepts clearly, helping students understand the significance of different graph types before engaging with questions. The multiple-choice format allows students to test their understanding interactively, encouraging reasoning and critical thinking. By analyzing questions about scatterplots and histograms, students refine their ability to interpret data visuals and grasp their applications in scientific contexts. The answer key offers immediate feedback, reinforcing correct understanding and guiding students toward areas that need further review. As students work independently or with peer support, this worksheet promotes confidence in reading graphics accurately, leading to deeper comprehension and stronger data analysis skills that are vital for success in science.
Core Skills Students Will Develop- ➡️ Interpreting data from various types of graphs and charts
- ➡️ Understanding the purpose and function of scatterplots and histograms
- ➡️ Analyzing visual data to draw scientific conclusions
- ➡️ Applying critical thinking to interpret graphical information
This worksheet is a versatile resource for classroom instruction, suitable for classwork, homework assignments, or assessment reviews. Teachers often incorporate it into lessons to provide targeted practice after introducing data analysis concepts, or as a formative assessment to gauge understanding. It can also serve as an early finisher activity or small-group exercise, helping students reinforce learning outside of direct instruction. Its clear format makes it easy to integrate into various instructional routines, supporting differentiated learning at different student levels.
Why This PDF Saves TimeThis resource is formatted as a print-ready PDF, allowing teachers to simply print and distribute without any preparation. The straightforward layout reduces planning time and ensures consistency in delivery and grading. The included answer key facilitates quick assessment and feedback, saving valuable time during lesson planning, especially when evaluating multiple student responses. Its ready-to-use design makes it a dependable tool for busy classrooms, providing instant support for effective teaching of graphical literacy skills.
Rest assured, this worksheet is designed with your classroom needs in mind—easy to print, simple to implement, and focused on helping students succeed with confidence. You’re ready to help your students master graphical analysis today! 😊