Grade 9 Science — Worksheet MCQ Paper for Measuring Central Tendency
Description
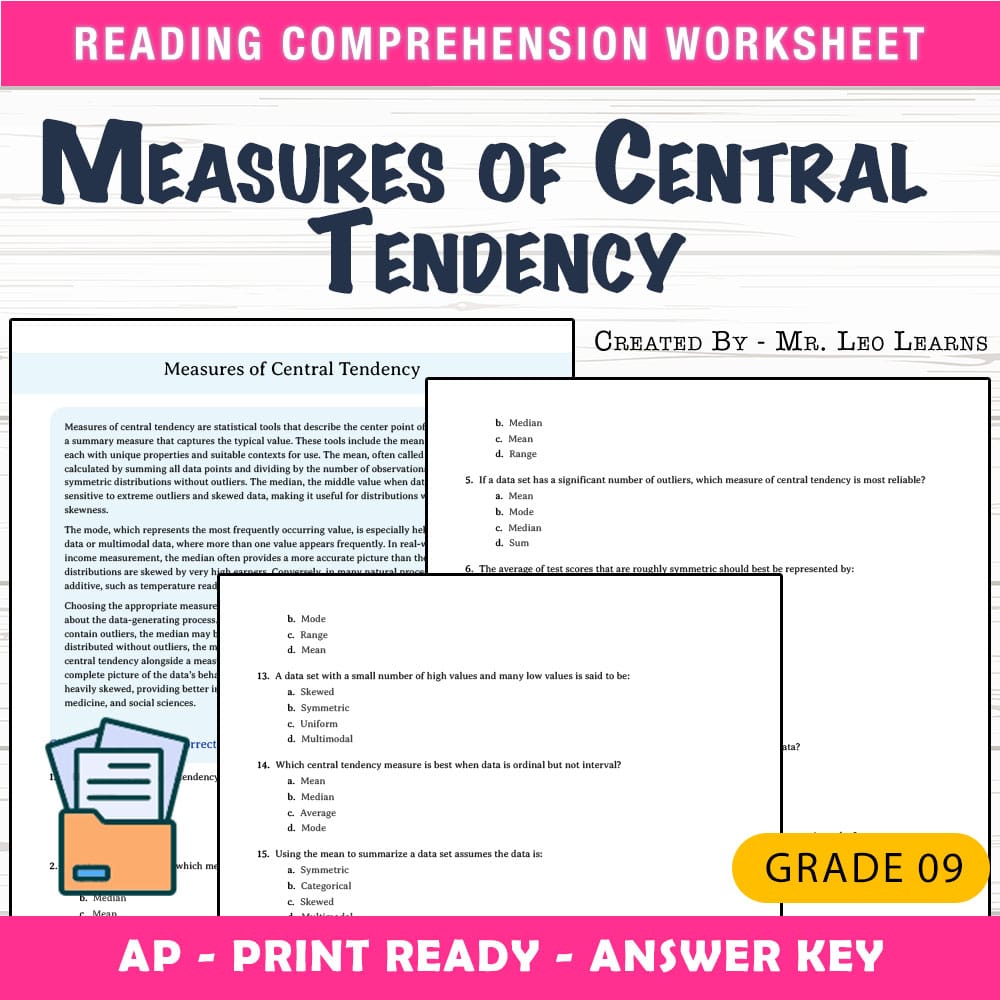
Imagine walking into your classroom and seeing students engaged in thinking about data and how to interpret their results. Some students are confidently answering questions about data distribution, while others are uncertain about which measure best represents the center of a data set. This worksheet provides a structured, straightforward way to reinforce understanding of measures of central tendency, including mean, median, and mode. Designed to support student learning and assessment, it helps clarify complex concepts in a clear and accessible format.
What This Resource Helps Students Do
This worksheet guides students through understanding the fundamental concepts of measures of central tendency by encouraging critical thinking and independent practice. With a reading passage explaining what measures of central tendency are and why they matter, students develop a contextual understanding of the topic. The multiple-choice questions then help them practice identifying the appropriate measure in different data scenarios, reinforce their understanding of outliers, skewed distributions, and the strengths and limitations of each measure. This resource encourages students to analyze data logically and apply their knowledge in real-world contexts.
Inside the PDF
• A thoughtful reading passage providing foundational knowledge about measures of central tendency.
• 25 multiple-choice questions designed for clear, step-by-step comprehension.
• A print-ready format that requires no preparation, perfect for classroom use.
• An answer key with rubric included for quick grading and feedback.
• Layout optimized for easy photocopying and classroom distribution.
How It Improves Learning
This worksheet enhances understanding by offering a balanced mix of informational reading and targeted questions that challenge students to apply what they've learned. The reading passage clarifies tricky concepts, helping reduce confusion and build confidence. The multiple-choice questions promote reasoning skills, encouraging students to analyze data scenarios critically and select the most appropriate measure. Repeated practice with diverse question types supports mastery and retention, ensuring students are better prepared for assessments and real-world data interpretation.
Core Skills Students Will Develop
- ➡️ Understanding statistical tools for data analysis
- ➡️ Identifying the best measure of center in various data sets
- ➡️ Analyzing how outliers affect averages
- ➡️ Interpreting skewed distributions and choosing appropriate measures
Ways Teachers Use This Worksheet
This worksheet serves multiple classroom purposes: it can be used as a classwork assignment to reinforce recent instruction, as homework to deepen understanding outside of class, or as a quick assessment to gauge students' grasp of measures of central tendency. It also functions well for small-group practice or review sessions and provides an effective way to differentiate instruction for students needing additional support. Early finishers can engage with the questions to extend their understanding, making this a versatile resource for various instructional needs.
Why This PDF Saves Time
This printable worksheet is designed for immediate use, eliminating the need for additional prep or formatting. The clear layout allows for quick photocopying, and the included answer key simplifies grading, saving valuable class time. Teachers can confidently print and distribute this resource knowing it is ready for effective classroom implementation, ensuring consistency across lessons without the need for extensive customization.
With this comprehensive worksheet, teachers can effortlessly support students in mastering the key concepts of measures of central tendency, helping them interpret data with confidence and clarity. It is a practical tool that promotes independent thinking and robust data analysis skills. 😊