
Graphical Literacy in Data Analysis Assessment for Grade 12 Science
Description
📘 Classroom Snapshot
Enhance your Grade 12 Science classroom with this comprehensive Graphical Literacy in Data Analysis assessment, designed to develop students' skills in interpreting and analyzing complex data through visual means. This standards-aligned assessment emphasizes graphical literacy as a core component of data analysis, providing a structured, paper-based resource perfect for classrooms focused on AP standards.
Students will engage with a variety of question types that build their ability to interpret graphs, perform data transformations, and evaluate model fits critically. This assessment fosters essential skills in visual data interpretation, critical thinking, and scientific reasoning, making it an ideal classroom-ready material for rigorous science courses in secondary education.
📝 Resource Details & Scope
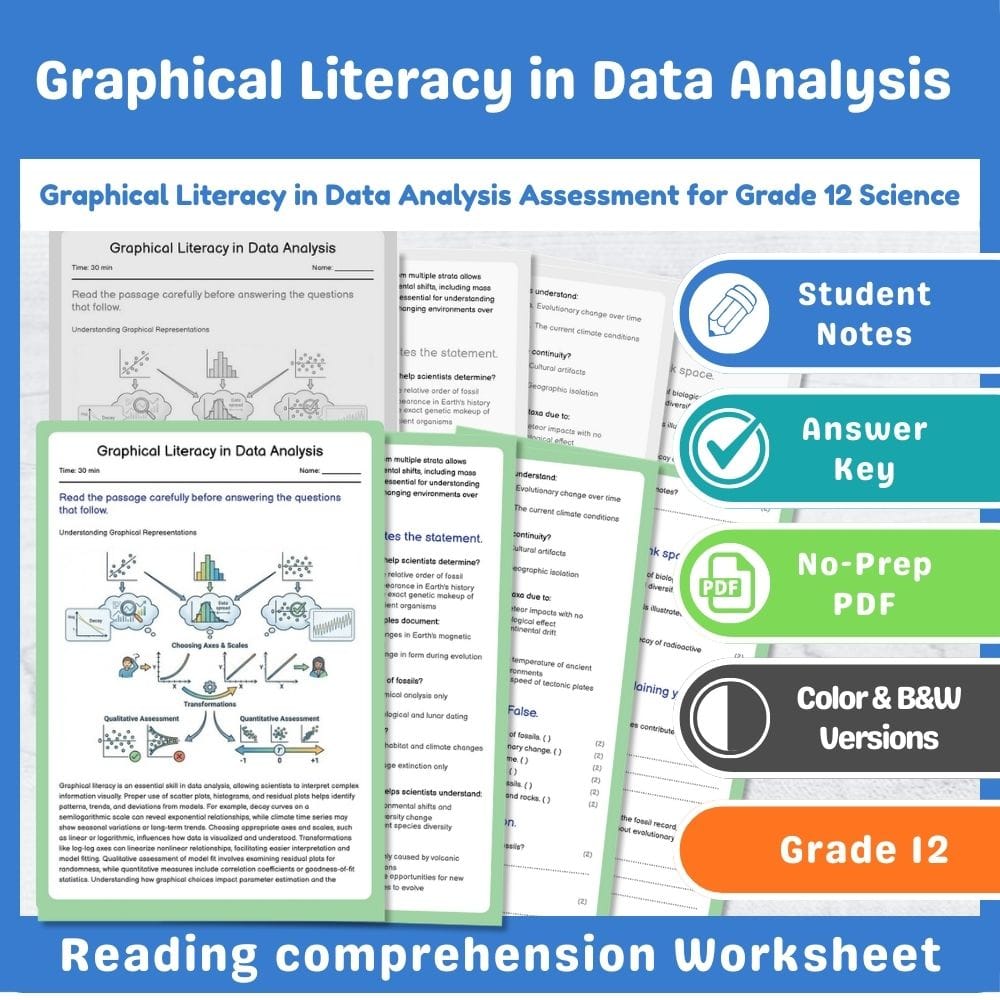
• Two worksheet formats: black-and-white version and full-color version (both included)
• Student Cornell Notes pages aligned to the lesson using a structured note-taking layout
• An infographic-style chart embedded within the worksheet to support visual understanding of the lesson
• Answer key included
• Multiple question types, including reading comprehension, multiple choice, true/false, short answer, fill-in-the-blank, and essay questions
• All files are provided as PDF only
• No digital or interactive materials are included—these are strictly printable, classroom-ready resources.
📊 Standards & Skills
• Appropriate for AP standards focusing on data analysis and graphical interpretation
• Develops measurable skills such as interpreting residual plots, transforming axes, and analyzing model fit
• Students will demonstrate their understanding by explaining data relationships, evaluating graphical representations, and using mathematical transformations in data visualization
⏱️ How This Saves You Time
This assessment is designed to streamline your lesson planning with classroom-ready, printables that require minimal prep. The structured format, integrated visuals, and student-focused note pages mean less time assembling materials and more time engaging with student learning. Use these worksheets to effectively evaluate graphical literacy skills and promote critical thinking about data representation and analysis.