
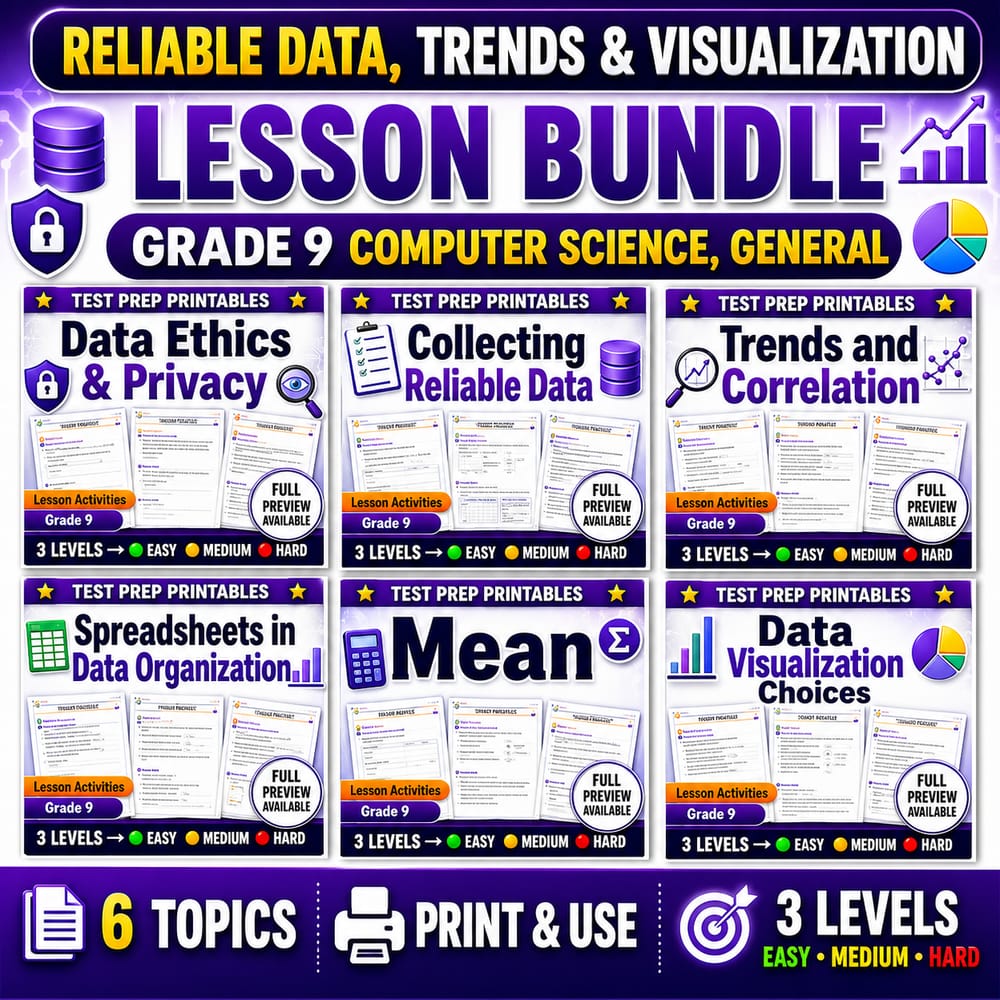
Reliable Data, Trends & Visualization Lesson Bundle | Grade 9 Computer Science, General
$24.00$30.00Save $6.00
Prism Point Learning
·2 followers·13 sales
SubjectComputer ScienceGradeGrade 9Pages182 Pages
What’s included
6 worksheets · 182 pages · Save $6.00 (20%) · prices shown inside the bundle
 Data Ethics and Privacy Computer Science Worksheet Grade 9
- Explain how data ethics guides fair and responsible data use.
- Describe privacy and consent and why they matter when handling personal information.
- Apply ethics vocabulary to real-life digital scenarios.
$4.00$5.00 Collecting Reliable Data Computer Science Worksheet Grade 9 Research
- Explain how consistent methods and clear variables improve the reliability of collected data.
- Use accurate recording procedures to reduce errors in surveys, experiments, and observations.
- Identify reliable vs. unreliable data-collection practices using lesson vocabulary.
$4.00$5.00 Grade 9 Trends and Correlation Computer Science Data Analysis Worksheet
- Explain the difference between a trend and a correlation.
- Identify patterns in data graphs and describe what they suggest.
- Interpret correlation carefully without claiming cause-and-effect.
$4.00$5.00 Spreadsheets for Data Organization Worksheet | Grade 9 Computer Science
- Describe how spreadsheets organize information using rows, columns, and cells.
- Use filters to find and sort relevant data in a spreadsheet.
- Create and interpret a simple spreadsheet layout for class or survey data.
$4.00$5.00 Mean vs Median Data Sets Worksheet Grade 9 Computer Science
- Explain the difference between mean and median for a numeric data set.
- Compute the mean and median from a list of values and interpret what they represent.
- Recognize when median is more reliable than mean in the presence of outliers.
$4.00$5.00 Data Visualization Choices Computer Science Worksheet Grade 9
- Choose an appropriate chart type to communicate patterns, comparisons, or trends in data.
- Use key visualization vocabulary (visualization, graph, chart, category) accurately in explanations.
- Evaluate whether a graph type matches the question being asked about the data.
$4.00$5.00
Reviews & Feedback
Loading reviews...
Questions & Answers
Loading questions…
About this bundle
Related categories
Frequently asked questions
Who is Reliable Data, Trends & Visualization Lesson Bundle | Grade 9 Computer Science, General designed for?
Reliable Data, Trends & Visualization Lesson Bundle | Grade 9 Computer Science, General is designed for Grade 9 students and Computer Science learners and can be used in classrooms, homeschool, or independent practice.
How do I download Reliable Data, Trends & Visualization Lesson Bundle | Grade 9 Computer Science, General?
Add it to your cart and complete checkout. After payment, you can download immediately from your account, and you'll also receive a download link by email.
