
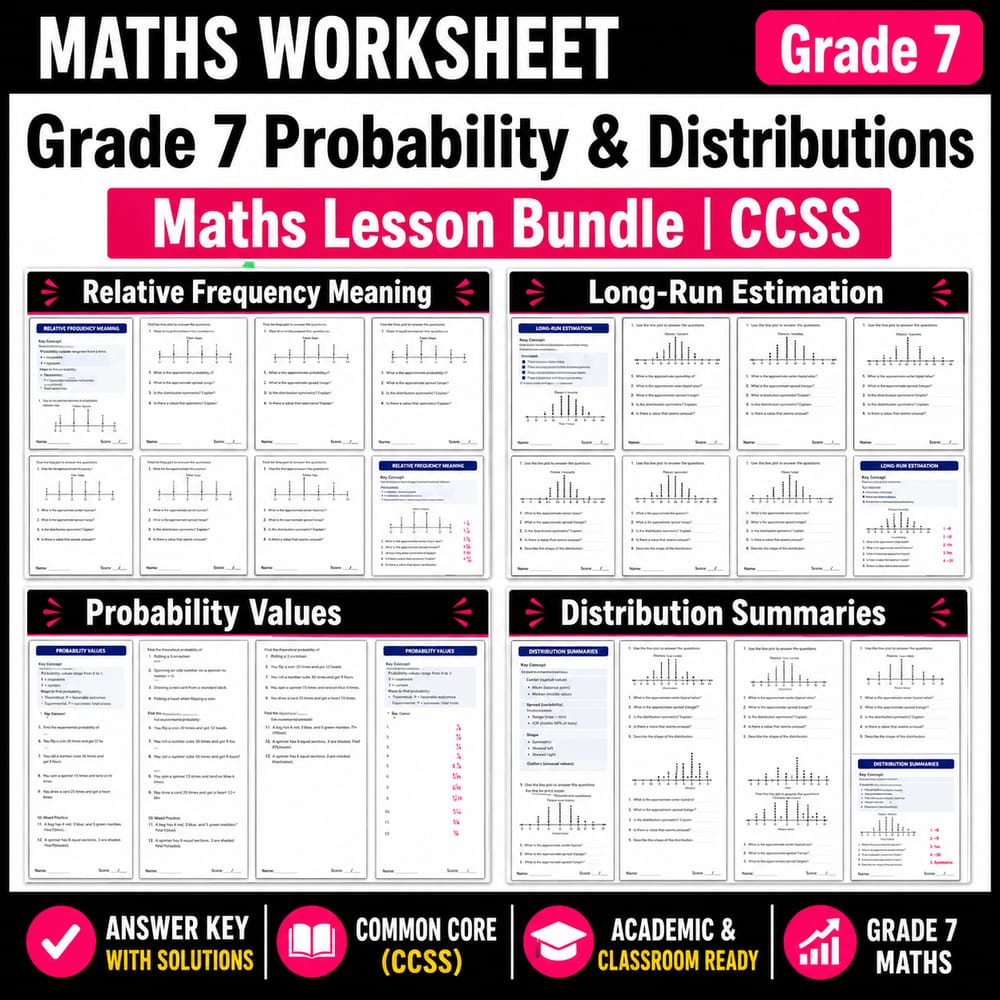
Grade 7 Probability & Distributions Maths Lesson Bundle | CCSS
$16.00$20.00Save $4.00
BRIGHT PATH RESOURCES
·3 followers·23 sales
SubjectMathsGradeGrade 7Pages74 Pages
What’s included
4 worksheets · 74 pages · Save $4.00 (20%) · prices shown inside the bundle
 Relative Frequency Meaning Worksheet | CCSS Grade 7 Maths Worksheet
- Define relative frequency as the fraction of times an event occurs in repeated trials
- Calculate relative frequency from a set of observed counts (and simplify the fraction)
- Use relative frequency to estimate probability and interpret it as long-run behavior
$4.00$5.00 Long-Run Estimation Worksheet | Common Core Grade 7 Math Practice PDF
- Use relative frequency (number of successes ÷ number of trials) to estimate a probability.
- Describe how relative frequency tends to stabilize as the number of trials increases.
- Compare experimental estimates to a probability model using closeness (error).
$4.00$5.00 Probability Values Worksheet for Grade 7 | Maths Worksheet with Answer Key
- Represent probability using numbers between 0 and 1 and interpret 0 and 1
- Match probability statements to inequalities and interval notation
- Convert probability values between decimal and fraction forms when outcomes are equally likely
$4.00$5.00 Distribution Summaries | Grade 7 Maths Worksheet – Common Core (CCSS)
- Summarize a distribution of relative frequency estimates using its center (typical value).
- Describe variability using measures such as the interquartile range (IQR) or range.
- Compare distributions from different chance processes by comparing their center and spread.
$4.00$5.00
Reviews & Feedback
Loading reviews...
Questions & Answers
Loading questions…
About this bundle
Related categories
Frequently asked questions
Who is Grade 7 Probability & Distributions Maths Lesson Bundle | CCSS designed for?
Grade 7 Probability & Distributions Maths Lesson Bundle | CCSS is designed for Grade 7 students and Maths learners and can be used in classrooms, homeschool, or independent practice.
How do I download Grade 7 Probability & Distributions Maths Lesson Bundle | CCSS?
Add it to your cart and complete checkout. After payment, you can download immediately from your account, and you'll also receive a download link by email.
Similar Products

Grade 12 Maths Lesson Group | Probability & Distributions Ontario Standards
$20.00$25.00

Grade 11 Statistics and Probability Lesson Bundle | CCSS Maths
$20.00$25.00

Grade 9 Statistics and Probability Lesson Bundle | Maths CCSS
$20.00$25.00

Grade 8 Math Data and Probability Lesson Bundle – Ontario Standards
$48.00$60.00

Grade 7 Data and Probability Math Bundle – Ontario Standards
$40.00$50.00