
Grade 9 Statistics and Probability Lesson Bundle | Maths CCSS
$20.00$25.00Save $5.00
BRIGHT PATH RESOURCES
·3 followers·23 sales
SubjectMathsGradeGrade 9Pages83 Pages
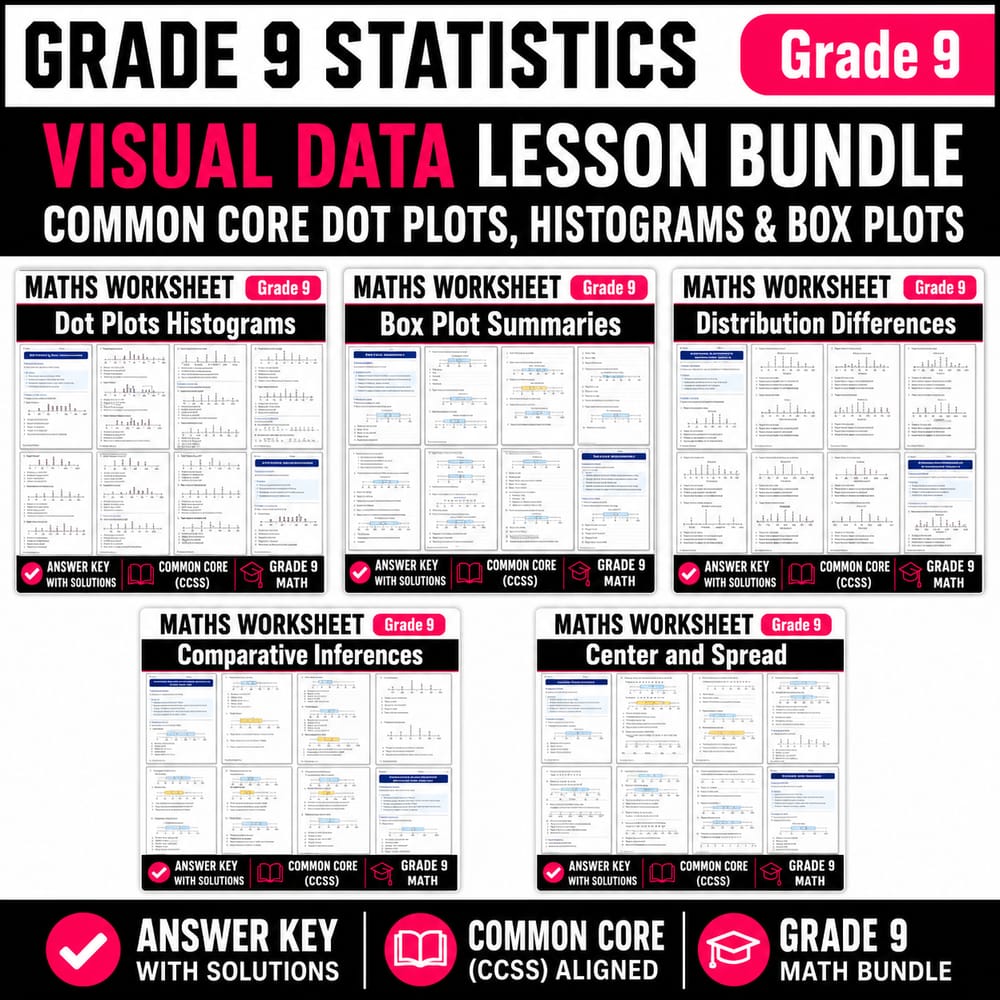
What’s included
5 worksheets · 83 pages · Save $5.00 (20%) · prices shown inside the bundle
 Grade 9 Dot Plots and Histograms Worksheet | Common Core Statistics
- Read a dot plot (line plot with stacked markers) to determine frequencies for specific values.
- Interpret histogram-style information by using bin boundaries to count how many observations fall in each interval.
- Use bin width correctly when comparing how often values occur (clusters vs gaps).
$4.00$5.00 Grade 9 Box Plot Summaries Worksheet | Common Core Statistics Practice
- Read a box plot to identify the five-number summary: minimum, Q1, median, Q3, and maximum.
- Calculate and interpret the interquartile range (IQR) from Q1 and Q3, including what it says about the middle 50% of the data.
- Use the 1.5 × IQR rule to identify outliers on a box plot.
$4.00$5.00 Grade 9 Distribution Differences Worksheet | Interpreting Visual Data CCSS
- Identify typical values (centre) such as the median and mode from line plots and box plots.
- Interpret spread (range and IQR) to describe variability and how it affects reliability or risk in real contexts.
- Use shape features (skewness, clustering, and gaps) and outliers to explain differences between data sets.
$4.00$5.00 Grade 9 Comparative Inferences Worksheet | Box Plots & Line Plots CCSS
- Use box plots to compare the center (median) and spread (IQR) of two groups.
- Use line plots to compare typical values and variability between groups by describing where most data cluster.
- Make informal comparative inferences about populations using sample summaries, including uncertainty and the effect of outliers.
$4.00$5.00 Grade 9 Center and Spread Worksheet | Common Core Statistics Practice
- Find and interpret median and interquartile range (IQR) from a box plot and explain what they say about center and spread.
- Use mean/median and range/IQR to compare two data sets, especially when one distribution is skewed or has outliers.
- Justify which statistical measure (median vs mean, IQR vs range) is most appropriate for a given distribution shape.
$4.00$5.00
Reviews & Feedback
Loading reviews...
Questions & Answers
Loading questions…
About this bundle
Related categories
Frequently asked questions
Who is Grade 9 Statistics and Probability Lesson Bundle | Maths CCSS designed for?
Grade 9 Statistics and Probability Lesson Bundle | Maths CCSS is designed for Grade 9 students and Maths learners and can be used in classrooms, homeschool, or independent practice.
How do I download Grade 9 Statistics and Probability Lesson Bundle | Maths CCSS?
Add it to your cart and complete checkout. After payment, you can download immediately from your account, and you'll also receive a download link by email.
Similar Products

Grade 11 Statistics and Probability Lesson Bundle | CCSS Maths
$20.00$25.00

Grade 6 Statistics & Data Analysis Math Worksheet Lesson Bundle for CCSS
$24.00$30.00

Grade 12 Math Lessons Bundle | Ontario Standards and Statistical Analysis
$20.00$25.00

Grade 8 Statistics and Probability Lesson Bundle | Common Core Maths
$20.00$25.00

Grade 6 Math Full-Year Bundle | Common Core CCSS Worksheets
$140.00$200.00