
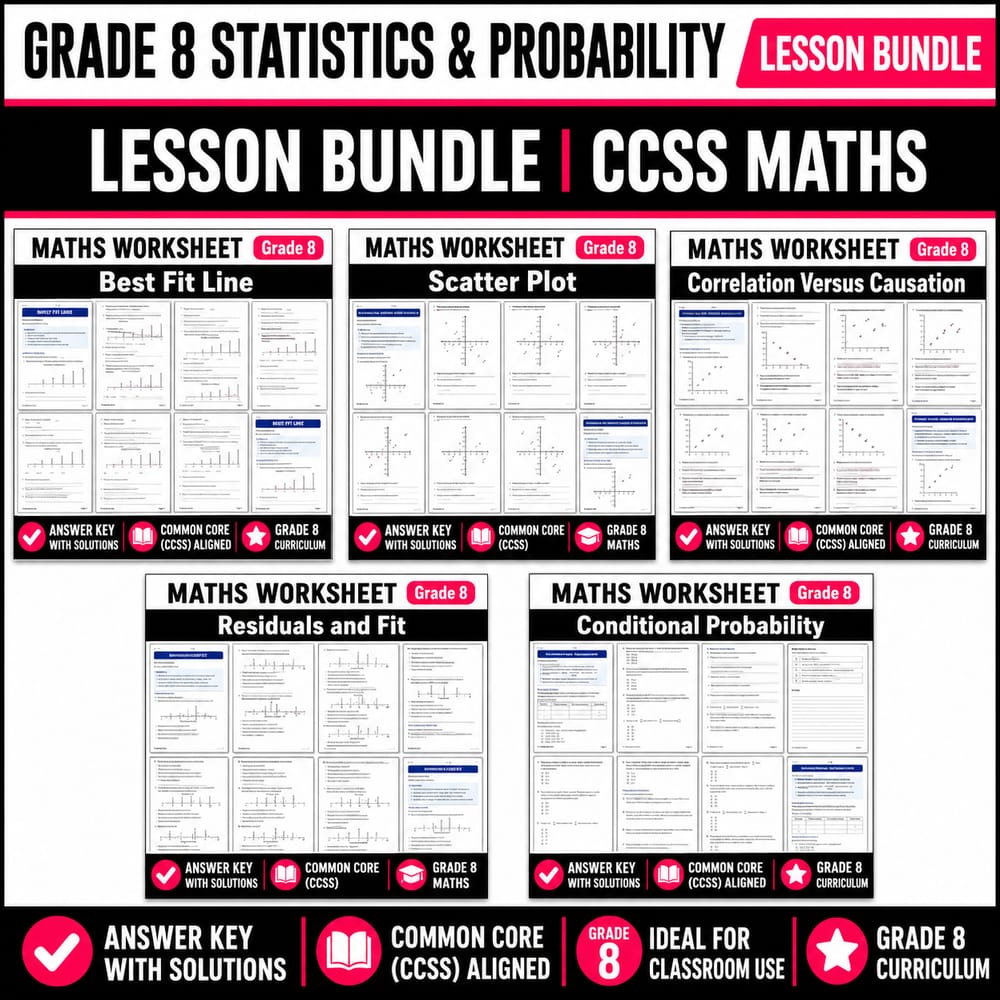
Grade 8 Statistics and Probability Lesson Bundle | Common Core Maths
$20.00$25.00Save $5.00
BRIGHT PATH RESOURCES
·3 followers·23 sales
SubjectMathsGradeGrade 8Pages94 Pages
What’s included
5 worksheets · 94 pages · Save $5.00 (20%) · prices shown inside the bundle
 Best Fit Line Worksheet for Grade 8 | Maths Worksheet – Common Core
- Use a line of best fit to model the overall trend in a scatter plot
- Calculate the slope and intercept of a best-fit line and interpret what they mean
- Use a best-fit line to make reasonable predictions within the domain of the data
$4.00$5.00 Grade 8 Maths Worksheet | Scatter Plots Direction and Strength CCSS
- Describe the direction of association in a scatter plot (positive, negative, or none).
- Judge the strength of association by how tightly points cluster around a general trend.
- Read coordinates from a scatter plot and use them to support conclusions about the pattern.
$4.00$5.00 Correlation Versus Causation Grade 8 Maths Worksheet | Common Core
- Identify whether a data display shows a positive, negative, or no association between two variables
- Explain why correlation (association) does not prove causation
- Use numerical features of graphs (center/spread/outliers) to describe relationships without making causal claims
$4.00$5.00 Residuals and Fit Worksheet for Grade 8 | Maths Worksheet – Common Core
- Define residuals as the vertical difference between an observed data value and the predicted value from a line of best fit
- Compute and interpret residuals (including the meaning of positive vs negative residuals) to judge how well a linear model fits
- Use patterns in residuals to decide whether a linear fit is appropriate or if a different model may be needed
$4.00$5.00 Conditional Probability Worksheet Grade 8 | Maths Worksheet | Common Core
- Use two-way tables to find conditional probabilities
- Calculate conditional probabilities from counts using P(A|B) = A∩B / B
- Interpret what conditional probability means in context and compare different conditions
$4.00$5.00
Reviews & Feedback
Loading reviews...
Questions & Answers
Loading questions…
About this bundle
Related categories
Frequently asked questions
Who is Grade 8 Statistics and Probability Lesson Bundle | Common Core Maths designed for?
Grade 8 Statistics and Probability Lesson Bundle | Common Core Maths is designed for Grade 8 students and Maths learners and can be used in classrooms, homeschool, or independent practice.
How do I download Grade 8 Statistics and Probability Lesson Bundle | Common Core Maths?
Add it to your cart and complete checkout. After payment, you can download immediately from your account, and you'll also receive a download link by email.
Similar Products

Grade 10 Statistics and Probability Lesson Bundle | Common Core Maths
$20.00$25.00

Grade 9 Statistics and Probability Lesson Bundle | Maths CCSS
$20.00$25.00

Grade 12 Math Lessons Bundle | Ontario Standards and Statistical Analysis
$20.00$25.00

Grade 11 Statistics and Probability Lesson Bundle | CCSS Maths
$20.00$25.00

Grade 6 Statistics & Data Analysis Math Worksheet Lesson Bundle for CCSS
$24.00$30.00