
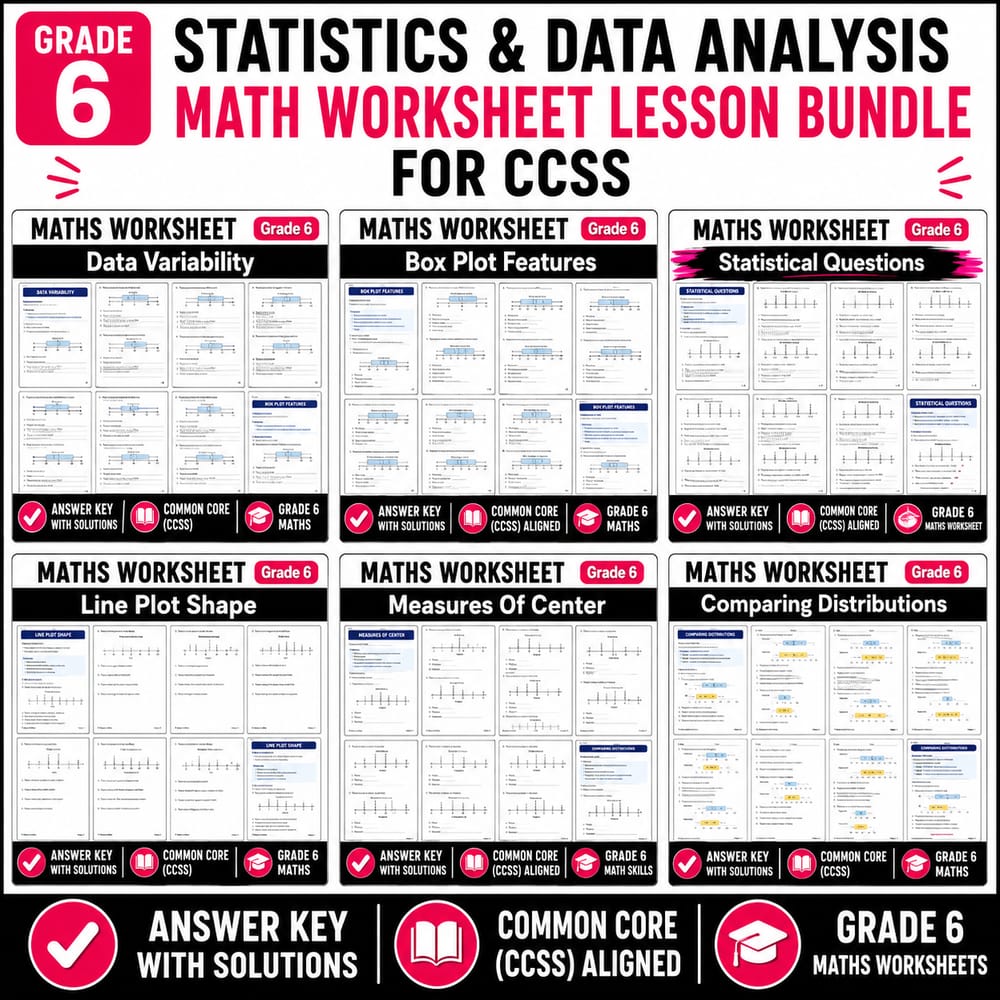
Grade 6 Statistics & Data Analysis Math Worksheet Lesson Bundle for CCSS
$24.00$30.00Save $6.00
Elena Brooks
·5 followers·12 sales
SubjectMathsGradeGrade 6Pages119 Pages
What’s included
6 worksheets · 119 pages · Save $6.00 (20%) · prices shown inside the bundle
 Data Variability in Math Worksheet | Grade 6 Data Variability | CCSS
- Identify variability in a data set by describing how spread out the values are (range and IQR).
- Read box plots to find quartiles and interpret the IQR as a measure of variability.
- Use line plots to describe variability by finding the mode, range, clusters, and gaps.
$4.00$5.00 Box Plot Features Worksheet Grade 6 | Maths Practice PDF & Answer Key
- Identify and interpret the median, quartiles (Q1 and Q3), and whiskers on a box plot
- Calculate the interquartile range (IQR) from Q1 and Q3
- Use box plot features to describe the spread (IQR and overall range) of a data set
$4.00$5.00 Grade 6 Maths Worksheet | Statistical Questions and Data Analysis – CCSS
- Identify when a question is statistical and explain how collected data is used to answer it.
- Use line plots to read frequencies and summarize data using features like mode, total frequency, and range.
- Use box plots to interpret median, quartiles (Q1 and Q3), and the interquartile range (IQR) to describe spread.
$4.00$5.00 Grade 6 Maths Worksheet | Line Plot Shape Practice with Answer Key
- Read a line plot to find key features such as the mode, range, and gaps.
- Describe the overall shape of a line plot by looking for clustering and spread.
- Use frequency information from stacked marks to support conclusions about where values concentrate and how values vary.
$4.00$5.00 Measures Of Center Grade 6 Maths Worksheet | Common Core CCSS
- Find the mean, median, and mode of a numerical data set shown in a line plot.
- Use median and interquartile range (IQR) to describe the typical value and spread of data from a box plot.
- Choose which measure of center (mean or median) best represents typical values when data are skewed or include outliers.
$4.00$5.00 Comparing Distributions for Grade 6 | Maths Worksheet with Answer Key
- Compare two numerical distributions using measures of center and spread (especially median and interquartile range).
- Use box plots to read quartiles (Q1, median, Q3), compute the IQR, and interpret variability.
- Describe how distributions differ by being shifted left or right and by having greater or smaller spread.
$4.00$5.00
Reviews & Feedback
Loading reviews...
Questions & Answers
Loading questions…
About this bundle
Related categories
Frequently asked questions
Who is Grade 6 Statistics & Data Analysis Math Worksheet Lesson Bundle for CCSS designed for?
Grade 6 Statistics & Data Analysis Math Worksheet Lesson Bundle for CCSS is designed for Grade 6 students and Maths learners and can be used in classrooms, homeschool, or independent practice.
How do I download Grade 6 Statistics & Data Analysis Math Worksheet Lesson Bundle for CCSS?
Add it to your cart and complete checkout. After payment, you can download immediately from your account, and you'll also receive a download link by email.
Similar Products

Grade 12 Math Lessons Bundle | Ontario Standards and Statistical Analysis
$20.00$25.00

Grade 11 Statistics and Probability Lesson Bundle | CCSS Maths
$20.00$25.00

Grade 6 Math Full-Year Bundle | Common Core CCSS Worksheets
$140.00$200.00

Grade 9 Statistics and Probability Lesson Bundle | Maths CCSS
$20.00$25.00

Grade 7 Probability & Distributions Maths Lesson Bundle | CCSS
$16.00$20.00