
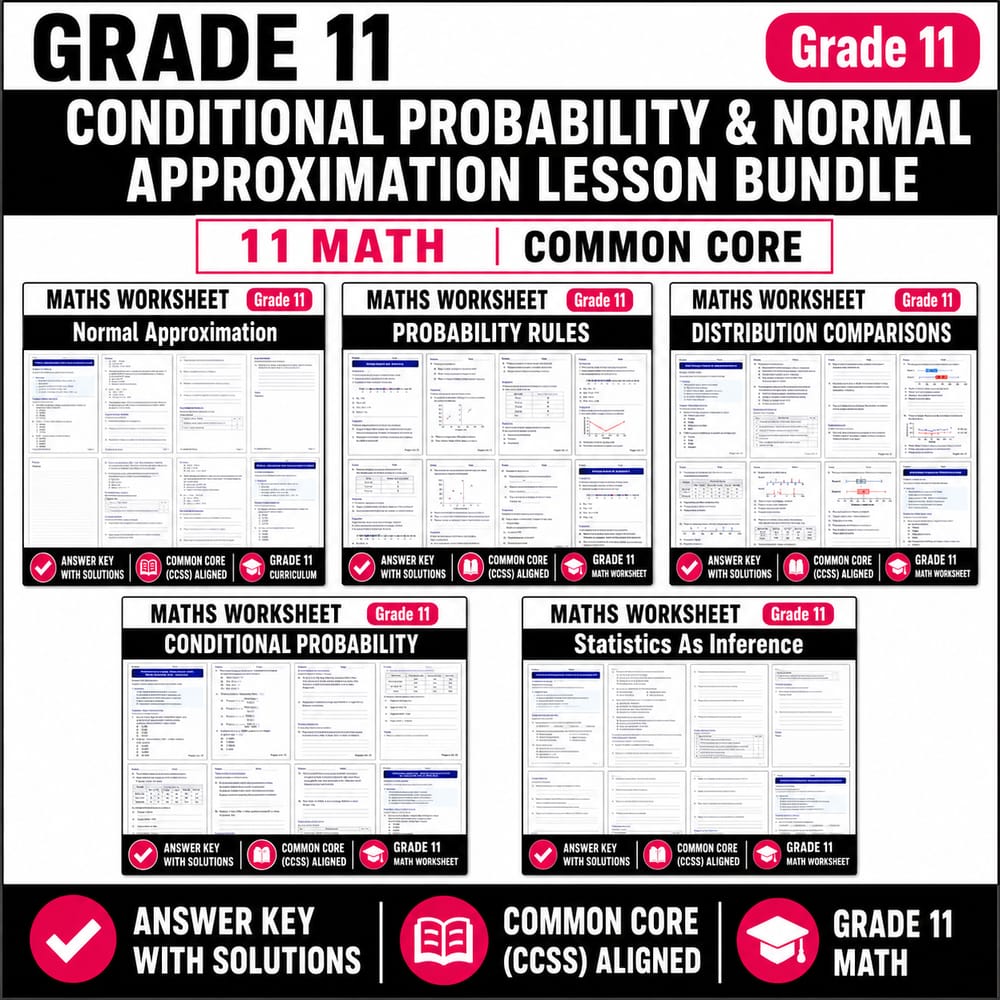
Grade 11 Statistics and Probability Lesson Bundle | CCSS Maths
$20.00$25.00Save $5.00
BRIGHT PATH RESOURCES
·3 followers·23 sales
SubjectMathsGradeGrade 11Pages54 Pages
What’s included
5 worksheets · 54 pages · Save $5.00 (20%) · prices shown inside the bundle
 Grade 11 Normal Approximation Worksheet | Standard Scores & Z-Scores
- Standardize a normal random variable using z = (x − μ)/σ
- Approximate probabilities for normal intervals using standard normal CDF values
- Use continuity correction when approximating binomial probabilities with a normal model
$4.00$5.00 Probability Rules Worksheet Grade 11 Statistics CCSS Maths Practice
- Use the addition rule to find probabilities of unions of events (including mutually exclusive and overlapping events).
- Use the multiplication rule, including conditional probability: P(A ∩ B) = P(A|B)P(B).
- Use complements to simplify probability calculations.
$4.00$5.00 Grade 11 Distribution Comparisons Worksheet | Statistics Analysis CCSS
- Compare two data distributions using their center, spread, and shape.
- Interpret how differences in mean/median and measures of spread (range/IQR) affect conclusions.
- Use skewness and outliers to explain why summary statistics may differ between two data sets.
$4.00$5.00 Conditional Probability Diagnostic Test Worksheet | Grade 11 Math CCSS
- Use Bayes’ theorem to interpret test results (e.g., PPV and NPV)
- Calculate probabilities of positive/negative test outcomes using sensitivity, specificity, and prevalence
- Distinguish between P(D|+) and P(+|D) and explain why they differ
$4.00$5.00 Grade 11 Statistics as Inference Worksheet | Sampling & Uncertainty
- Explain how random sampling and sampling variability affect statistical conclusions.
- Distinguish between a population parameter and a sample statistic when making inferences.
- Interpret confidence intervals as estimates that reflect uncertainty, not exact values.
$4.00$5.00
Reviews & Feedback
Loading reviews...
Questions & Answers
Loading questions…
About this bundle
Related categories
Frequently asked questions
Who is Grade 11 Statistics and Probability Lesson Bundle | CCSS Maths designed for?
Grade 11 Statistics and Probability Lesson Bundle | CCSS Maths is designed for Grade 11 students and Maths learners and can be used in classrooms, homeschool, or independent practice.
How do I download Grade 11 Statistics and Probability Lesson Bundle | CCSS Maths?
Add it to your cart and complete checkout. After payment, you can download immediately from your account, and you'll also receive a download link by email.
Similar Products

Grade 6 Statistics & Data Analysis Math Worksheet Lesson Bundle for CCSS
$24.00$30.00

Grade 9 Statistics and Probability Lesson Bundle | Maths CCSS
$20.00$25.00

Grade 12 Math Lessons Bundle | Ontario Standards and Statistical Analysis
$20.00$25.00

Grade 8 Statistics and Probability Lesson Bundle | Common Core Maths
$20.00$25.00

Grade 6 Math Full-Year Bundle | Common Core CCSS Worksheets
$140.00$200.00